UNITED STATES
SECURITIES AND EXCHANGE COMMISSION
Washington, D.C. 20549
FORM 10-K
| [X] | ANNUAL REPORT PURSUANT TO SECTION 13 OR 15(d) OF THE SECURITIES EXCHANGE ACT OF 1934 |
For the fiscal year ended December 31, 2011
OR
| ¨ | TRANSITION REPORT PURSUANT TO SECTION 13 OR 15(d) OF THE SECURITIES EXCHANGE ACT OF 1934 |
For the transition period from to ____________.
Commission File Number: 0-19582
OLD DOMINION FREIGHT LINE, INC.
(Exact name of registrant as specified in its charter)
| VIRGINIA | 56-0751714 | |
| (State or other jurisdiction of incorporation or organization) |
(I.R.S. Employer Identification No.) |
500 Old Dominion Way
Thomasville, NC 27360
(Address of principal executive offices)
(Zip Code)
(336) 889-5000
(Registrant’s telephone number, including area code)
Securities registered pursuant to Section 12(b) of the Act:
| Title of each class |
Name of each exchange on which registered | |
| Common Stock ($0.10 par value) | The NASDAQ Stock Market LLC (NASDAQ Global Select Market) |
Securities registered pursuant to Section 12(g) of the Act: None
Indicate by check mark if the registrant is a well-known seasoned issuer, as defined in Rule 405 of the Securities Act. Yes x No ¨
Indicate by check mark if the registrant is not required to file reports pursuant to Section 13 or Section 15(d) of the Act. Yes ¨ No x
Indicate by check mark whether the registrant (1) has filed all reports required to be filed by Section 13 or 15(d) of the Securities Exchange Act of 1934 during the preceding 12 months (or for such shorter period that the registrant was required to file such reports), and (2) has been subject to such filing requirements for the past 90 days. Yes x No ¨
Indicate by check mark whether the registrant has submitted electronically and posted on its corporate Website, if any, every Interactive Data File required to be submitted and posted pursuant to Rule 405 of Regulation S-T (§232.405 of this chapter) during the preceding 12 months (or for such shorter period that the registrant was required to submit and post such files). Yes x No ¨
Indicate by check mark if disclosure of delinquent filers pursuant to Item 405 of Regulation S-K (§229.405 of this chapter) is not contained herein, and will not be contained, to the best of registrant’s knowledge, in definitive proxy or information statements incorporated by reference in Part III of this Form 10-K or any amendment to this Form 10-K. x
Indicate by check mark whether the registrant is a large accelerated filer, an accelerated filer, a non-accelerated filer, or a smaller reporting company. See the definitions of “large accelerated filer,” “accelerated filer” and “smaller reporting company” in Rule 12b-2 of the Exchange Act.
| Large accelerated filer x | Accelerated filer ¨ | |||
| Non-accelerated filer ¨ | Smaller reporting company ¨ | |||
| (Do not check if a smaller reporting company) | ||||
Indicate by check mark whether the registrant is a shell company (as defined in Rule 12b-2 of the Act). Yes ¨ No x
The aggregate market value of voting stock held by non-affiliates of the registrant as of June 30, 2011 was $1,567,488,262, based on the closing sales price as reported on the NASDAQ Global Select Market.
As of February 28, 2012, the registrant had 57,443,324 outstanding shares of Common Stock ($0.10 par value).
DOCUMENTS INCORPORATED BY REFERENCE
Certain portions of the Company’s Proxy Statement for the 2012 Annual Meeting of Shareholders are incorporated by reference into Part III of this report.
| 1 | ||||||
| 1 | ||||||
| Item 1 |
Business | 1 | ||||
| Item 1A |
Risk Factors | 7 | ||||
| Item 1B |
Unresolved Staff Comments | 14 | ||||
| Item 2 |
Properties | 14 | ||||
| Item 3 |
Legal Proceedings | 15 | ||||
| Item 4 |
Mine Safety Disclosures | 15 | ||||
| 52 | ||||||
| Item 15 |
Exhibits, Financial Statement Schedules | 52 | ||||
| 53 | ||||||
| 54 | ||||||
Forward-looking statements appear in this Annual Report, including but not limited to Item 7, “Management’s Discussion and Analysis of Financial Condition and Results of Operations,” and in other written and oral statements made by or on behalf of us. These forward-looking statements include, but are not limited to, statements relating to our goals, strategies, expectations, competitive environment, regulation, availability of resources, future events and future financial performance. Such forward-looking statements are made pursuant to the safe harbor provisions of the Private Securities Litigation Reform Act of 1995. These forward-looking statements typically can be identified by such words as “anticipate,” “estimate,” “forecast,” “project,” “intend,” “expect,” “believe,” “should,” “could,” “may,” or other similar words or expressions. We caution readers that such forward-looking statements involve risks and uncertainties that could cause actual events or results to differ materially from those expressed or implied herein, including, but not limited to, the risk factors detailed in this Annual Report.
Our forward-looking statements are based on our beliefs and assumptions using information available at the time the statements are made. We caution the reader not to place undue reliance on our forward-looking statements as (i) these statements are neither a prediction nor a guarantee of future events or circumstances and (ii) the assumptions, beliefs, expectations and projections about future events may differ materially from actual results. We undertake no obligation to publicly update any forward-looking statement to reflect developments occurring after the statement is made.
Unless the context requires otherwise, references in this report to “Old Dominion,” the “Company,” “we,” “us” and “our” refer to Old Dominion Freight Line, Inc.
Overview
Old Dominion is a leading, less-than-truckload (“LTL”), union-free motor carrier providing regional, inter-regional and national LTL service and value-added logistics services from a single integrated organization. We are the seventh largest LTL motor carrier in the United States, as measured by 2010 revenue, according to Transport Topics. In addition to our core LTL services, we offer our customers a broad range of logistics services including ground and air expedited transportation, supply chain consulting, transportation management, truckload brokerage, container delivery and warehousing services. Additionally in 2012, we expanded our logistics services to include consumer household moving services, which provide customers with a self-service moving option for their household goods. Through marketing and carrier relationships, we also offer door-to-door international freight services to and from all of North America, Central America, South America and the Far East. Our services are complemented by our technological capabilities, which we believe provide the tools to improve the efficiency of our operations while empowering our customers to manage their shipping needs.
We have grown our revenue and customer base through both organic growth and strategic acquisitions and provide our domestic LTL services throughout the entire continental United States. Our infrastructure allows us to provide next-day and second-day service within each of our six regions, as well as inter-regional and national service between these regions. To support our ongoing expansion, we added 34 new service centers in the past five years for a total of 216 at December 31, 2011.
We believe our growth can be attributed to our focus on meeting our customers’ complete supply chain needs from a single point of contact with a high level of customer service supported by ongoing investment in our employees, service center network and technology. Our integrated structure allows us to offer our customers consistent high-quality service from origin to destination. We believe our operating structure and proprietary information systems also enable us to efficiently manage our operating costs, which allows us to provide this high-quality service at a fair and equitable price.
1
We were organized in 1934 and incorporated in Virginia in 1950. Our principal executive offices are located at 500 Old Dominion Way, Thomasville, North Carolina 27360. Please refer to the Balance Sheets and Statements of Operations included in Item 8, “Financial Statements and Supplementary Data” of this report for information regarding our total assets, revenue from operations and net income.
Our Industry
Trucking companies provide transportation services to virtually every industry operating in the United States and generally offer higher levels of reliability and faster transit times than other surface transportation options. The trucking industry is comprised principally of two types of motor carriers: LTL and truckload. LTL carriers typically pick up multiple shipments from multiple customers on a single truck and then route that freight for delivery through service centers where the freight may be transferred to other trucks with similar destinations. In contrast, truckload carriers generally dedicate an entire trailer to one customer from origin to destination.
According to the American Trucking Associations, total U.S. freight transportation revenue in 2010 was $694.2 billion, of which the trucking industry accounted for 81.2%. The LTL sector had revenue in 2010 of $40.4 billion, which represented 5.8% of total U.S. freight transportation revenue. In contrast to truckload carriers, LTL motor carriers require expansive networks of local pickup and delivery (“P&D”) service centers, as well as larger breakbulk, or hub, facilities. Significant capital is required of LTL motor carriers to create and maintain a network of service centers and a fleet of tractors and trailers. The high fixed costs and capital spending requirements for LTL motor carriers makes it difficult for new start-up or small operators to effectively compete with established companies. In addition, successful LTL motor carriers generally employ, and continuously update, a high level of technology to provide information to customers and to reduce operating costs.
The LTL industry is highly competitive on the basis of service and price and has consolidated significantly since the industry was deregulated in 1980. Based on 2010 revenue as reported in Transport Topics, the top 25 LTL motor carriers accounted for approximately 67% of the total LTL market. Consolidation has accelerated in recent years due to an increase in customer demand for single transportation providers offering both national and regional LTL service and complex supply chain services. Smaller regional carriers with lesser financial resources are generally unable to meet this demand. As a result, we believe consolidation in our industry will continue.
Competition
We compete with regional, inter-regional and national LTL carriers and, to a lesser extent, with truckload carriers, small package carriers, airfreight carriers and railroads. Competition is based primarily on service, price and business relationships. We believe we are able to compete effectively in our markets by providing high-quality and timely service at competitive prices.
At all levels of our organization, we seek to continuously improve customer service by maximizing on-time performance while reducing transit times and minimizing cargo claims. We believe our transit times are generally faster than those of our principal national competitors, in part because of our more efficient service center network, use of team drivers and proprietary technology. In addition, we provide greater geographic coverage than most of our regional competitors. Our diversified mix and scope of regional, inter-regional and national service, combined with our value-added service offerings, enables us to provide our customers with a single source to meet their shipping and logistics needs. We believe this provides us with a distinct advantage over our regional, multi-regional and national competition.
We utilize flexible scheduling and train our union-free employees to perform multiple tasks, which we believe allows us to achieve greater productivity and higher levels of customer service than our competitors. We believe our focus on employee communication, continued education, development and motivation strengthens the relationships and trust among our employees.
We compete with several larger transportation service providers, each of which may have more equipment, a broader global network and a wider range of services than we have. Our larger competitors may also have greater financial resources and, in general, the ability to reduce prices to gain business, especially during times of reduced growth rates in the economy.
2
Service Center Operations
At December 31, 2011, we conducted operations through 216 service center locations, of which we owned 139 and leased 77. We operate ten major breakbulk facilities in Rialto, California; Atlanta, Georgia; Chicago, Illinois; Indianapolis, Indiana; Greensboro, North Carolina; Harrisburg, Pennsylvania; Memphis and Morristown, Tennessee; Dallas, Texas; and Salt Lake City, Utah, while using other service centers for limited breakbulk activity in order to serve our next-day markets. Our service centers are strategically located in six regions of the country to provide the highest quality service and minimize freight rehandling costs.
Each of our service centers is responsible for the pickup and delivery of freight within its service area. Each service center loads outbound freight by destination the day it is picked up. All inbound freight received by the service center in the evening or during the night is scheduled for local delivery the next business day, unless a customer requests a different delivery schedule. Our management reviews the productivity and service performance of each service center on a daily basis to help ensure quality service and efficient operations.
While we have established primary responsibility for customer service at the local service center level, our customers may access information and initiate transactions through our centralized customer service department located at our corporate office or through several other gateways, such as our website, electronic data interchange (“EDI”), email and fax notification systems and automated voice response systems. Our systems offer direct access to information such as freight tracking, shipping documents, rate quotes, rate databases and account activity. These centralized systems and our customer service department provide our customers with a single point of contact to access information across all areas of our operations and for each of our service products.
Linehaul Transportation
Linehaul dispatchers control the movement of freight among service centers through integrated freight movement systems. We also utilize load-planning software to optimize efficiencies in our linehaul operations. Our senior management monitors freight movements, transit times, load factors and other productivity measurements to ensure that we maintain our highest levels of service and efficiency.
We utilize scheduled routes, and additional linehaul dispatches as necessary, to meet our published service standards. In addition, we lower our cost structure by maintaining flexible workforce rules and by primarily using twin 28-foot trailers in our linehaul operations. The use of twin 28-foot trailers permits us to transport freight directly from its point of origin to destination with minimal unloading and reloading, which also reduces cargo loss and damage expenses. We utilize long-combination vehicles, such as triple 28-foot trailers and combinations of 48-foot and 28-foot trailers, in states where permitted. Twin trailers and long-combination vehicles permit more freight to be hauled behind a tractor than could otherwise be hauled by one large trailer.
Tractors, Trailers and Maintenance
At December 31, 2011, we owned 5,830 tractors. We generally use new tractors in linehaul operations for approximately three to five years and then transfer those tractors to P&D operations for the remainder of their useful lives. In many of our service centers, tractors perform P&D functions during the day and linehaul functions at night to maximize tractor utilization.
3
At December 31, 2011, we owned 22,685 trailers. We primarily purchase new trailers for our operations; however, we occasionally purchase pre-owned equipment that meets our specifications. The purchase of pre-owned equipment can provide an excellent value but also can increase our fleet’s average age. The table below reflects, as of December 31, 2011, the average age of our tractors, trucks and trailers:
| Type of Equipment (Categorized by primary use) |
Number of Units |
Average Age (in years) |
||||||
| Linehaul tractors |
3,668 | 3.4 | ||||||
| P&D tractors |
2,162 | 8.7 | ||||||
| P&D trucks |
109 | 5.4 | ||||||
| Linehaul trailers |
16,302 | 7.6 | ||||||
| P&D trailers |
6,383 | 13.0 | ||||||
We develop certain specifications for tractors and trailers and then negotiate the production and purchase of this equipment with several manufacturers. These purchases are planned well in advance of anticipated delivery dates in order to accommodate manufacturers’ production schedules. We believe there is sufficient capacity among suppliers to ensure an uninterrupted supply of equipment to support our operations.
The table below sets forth our capital expenditures for tractors and trailers for the years ended December 31, 2011, 2010 and 2009. For more information concerning our capital expenditures, see Item 7, “Management’s Discussion and Analysis of Financial Condition and Results of Operations – Liquidity and Capital Resources” of this report.
| Year Ended December 31, | ||||||||||||
| (In thousands) |
2011 | 2010 | 2009 | |||||||||
| Tractors |
$ | 69,837 | $ | 35,777 | $ | 33,072 | ||||||
| Trailers |
62,326 | 5,020 | 32,639 | |||||||||
|
|
|
|
|
|
|
|||||||
| Total |
$ | 132,163 | $ | 40,797 | $ | 65,711 | ||||||
|
|
|
|
|
|
|
|||||||
At December 31, 2011, we had major maintenance operations at our service centers in Rialto, California; Denver, Colorado; Atlanta, Georgia; Indianapolis, Indiana; Kansas City and Parsons, Kansas; Greensboro, North Carolina; Columbus, Ohio; Harrisburg, Pennsylvania; Morristown and Memphis, Tennessee; Dallas, Texas; and Salt Lake City, Utah. In addition, 19 other service center locations are equipped to perform routine and preventive maintenance and repairs on our equipment.
We adhere to established maintenance policies and procedures to help ensure our fleet is properly maintained. Linehaul tractors are routed to appropriate maintenance facilities at designated intervals, depending upon how the equipment has been utilized. P&D tractors and trailers are scheduled for maintenance every 90 days.
Marketing and Customers
At December 31, 2011, we had a sales staff of 496 employees. We compensate our sales force, in part, based upon certain operating metrics to help motivate our sales employees to achieve our service, growth and profitability objectives.
We utilize an integrated freight-costing system to determine the price level at which a particular shipment of freight will be profitable. We can modify elements of this freight-costing model to simulate the actual conditions under which the freight will be moved. We also compete for business by participating in bid solicitations. Customers generally solicit bids for relatively large numbers of shipments for a period of one to two years, and typically choose to enter into contractual arrangements with a limited number of motor carriers based upon price and service.
Revenue is generated by customers dispersed primarily throughout the United States and North America. In 2011, our largest customer accounted for approximately 2.6% of our revenue and our largest 5, 10 and 20 customers accounted for approximately 9.1%, 14.3% and 21.4% of our revenue, respectively. For each of the previous three years, approximately 90% of our revenue was derived from transporting LTL shipments for our customers and less than 5% of our revenue was generated from international services. We believe the diversity of our customer base helps protect our business from adverse developments in a single geographic region and the reduction or loss of business from a single customer.
4
Seasonality
Our operations are subject to seasonal trends common in the trucking industry. Our operating margins in the first quarter are normally lower due to reduced demand during the winter months. Harsh weather can also adversely affect our performance by reducing demand and reducing our ability to transport freight, which could result in decreased revenue and increased operating expenses.
Technology
We continually upgrade our technological capabilities, and we provide access to our systems through multiple gateways that offer our customers maximum flexibility and immediate access to information. We employ vehicle safety systems, on-board and hand-held computer systems, freight handling systems and logistics technology to reduce costs and transit times. We continue to focus on the development and enhancement of the technology used in our operations in order to improve the efficiency and effectiveness of our services.
Insurance
We carry a significant amount of insurance with third-party insurance carriers, but we are exposed to the risk of loss on claims up to the limit for which we are self-insured. We are currently self-insured for bodily injury and property damage (“BIPD”) claims up to $2.75 million per occurrence. Cargo loss and damage claims are self-insured up to $100,000 per occurrence. We are exposed to workers’ compensation claims up to $1.0 million per occurrence, through either self-insurance or insurance deductibles. Effective January 1, 2012, our group health claims are self-insured up to $400,000 per occurrence, an increase from $375,000 in 2011, plus an aggregate $200,000 over our retention level.
We believe that our policy of self-insuring a portion of our risks, supported by our safety and loss prevention programs, is an effective means of managing insurance costs. We also believe that our current insurance coverage is adequate to cover our liability risks.
Diesel Fuel Availability and Cost
Our industry depends heavily upon the availability of diesel fuel. Although we maintained fuel storage and pumping facilities at 47, or 22%, of our service center locations at December 31, 2011, we may experience shortages at certain locations and may be forced to incur additional expense to help ensure adequate supply on a timely basis to prevent a disruption to our service schedules. We implemented a fuel surcharge program in August 1999, which has remained in effect since that time and is one of many components that we use to determine the overall price for our transportation services. Our fuel surcharges are generally indexed to fuel prices published by the U.S. Department of Energy (the “DOE”) that reset each week. Our management believes that our operations and financial condition are susceptible to the same diesel fuel price increases or shortages as those of our competitors. Diesel fuel costs, including fuel taxes, totaled 15.0%, 13.1% and 11.4% of revenue in 2011, 2010 and 2009, respectively.
Employees
As of December 31, 2011, we employed 12,022 individuals on a full-time basis, none of which were represented under a collective bargaining agreement. Our full-time employees work in the following roles:
| Category |
Number of Employees |
|||
| Drivers |
6,361 | |||
| Platform |
1,856 | |||
| Fleet technicians |
411 | |||
| Sales |
496 | |||
| Salaried, clerical and other |
2,898 | |||
|
|
|
|||
| Total |
12,022 | |||
|
|
|
|||
5
As of December 31, 2011, we employed 3,150 linehaul drivers and 3,211 P&D drivers on a full-time basis. We select our drivers primarily based upon safe driving records and experience. Each of our drivers is required to pass a drug test, have a current U.S. Department of Transportation (“DOT”) physical and have a valid commercial driver’s license prior to employment. Once employed, drivers are required to obtain and maintain hazardous materials endorsements to their commercial driver’s licenses. Drivers, as well as all employees, are required to take pre-employment drug and alcohol tests and are randomly selected for periodic additional testing.
To help fulfill driver needs, we offer qualified employees the opportunity to become drivers through the “Old Dominion Driver Training Program.” Since its inception in 1988, 2,994 individuals have graduated from this program. Of the program graduates, we have experienced an annual turnover rate of approximately 7.1%, which is below our Company-wide average turnover rate of approximately 12.5% for drivers. We believe our driver training and qualification programs have been important factors in improving our safety record and retaining our qualified drivers. Drivers with safe driving records are rewarded with bonuses of up to $3,000 payable each year. Driver safety bonuses paid during 2011 and 2010 were $2.3 million and $2.1 million, respectively.
Governmental Regulation
We are subject to regulation by the Federal Motor Carrier Safety Administration (the “FMCSA”), the Pipeline and Hazardous Materials Safety Agency and the Surface Transportation Board, which are agencies within the DOT, as well as the regulations of various state agencies. These regulatory authorities have broad powers, generally governing matters such as authority to engage in motor carrier operations, motor carrier registration, driver hours of service, safety and fitness of transportation equipment and drivers, certain mergers, consolidations and acquisitions, and periodic financial reporting. In addition, we are subject to compliance with cargo-security and transportation regulations issued by the Transportation Security Administration within the U.S. Department of Homeland Security.
In October 2009, the U.S. Court of Appeals for the District of Columbia Circuit ordered the FMCSA to review and re-issue rules governing hours of service for commercial truck drivers by July 26, 2011. This deadline was extended and on December 22, 2011, the FMCSA issued its final rule, which requires compliance by July 1, 2013. The final rule reduces the maximum number of hours a truck driver can work each week to 70 hours from the current 82-hour limit. The rule maintains the current maximum 11-hour daily driving limit, but requires drivers to take a 30-minute break prior to driving beyond eight hours. The rule also includes a “34-hour restart” provision that allows drivers to restart the clock on their work week by taking at least 34 consecutive hours off-duty, provided these 34 off-duty hours includes two periods between 1:00 a.m. and 5:00 a.m. and occurs only once during a seven-day period. We do not believe this new rule, when implemented, will have a significant impact on our operating procedures and will not significantly impact our costs. We are, however, subject to future rulemaking by the FMCSA, which could be more stringent, require changes to our operations, increase our operating costs and otherwise adversely impact our results of operations.
The trucking industry is subject to regulatory and legislative changes from a variety of other governmental authorities, which address matters such as: (i) increasingly stringent environmental and occupational safety and health regulations; (ii) limits on vehicle weight and size; (iii) ergonomics; (iv) port security; and (v) hours of service. These changes may affect our business or the economics of our industry by requiring changes in operating practices, or by influencing the demand for and increasing the costs of providing our services.
Environmental Regulation
We are subject to various federal, state and local environmental laws and regulations that focus on, among other things: the emission and discharge of hazardous materials into the environment or their presence on or in our properties and vehicles; fuel storage tanks; transportation of certain materials; and the discharge or retention of storm water. Under specific environmental laws, we could also be held responsible for any costs relating to contamination at our past or present facilities and at third-party waste disposal sites, as well as costs associated with clean-up of accidents involving our vehicles. We do not believe that the cost of future compliance with current environmental laws or regulations will have a material adverse effect on our operations, financial condition, competitive position or capital expenditures for the remainder of fiscal year 2012 or fiscal year 2013. However, future changes to laws or regulations may adversely affect our operations and could result in unforeseen costs to our business.
6
Available Information
Through our website, http://www.odfl.com, we make available, free of charge, our Annual Report on Form 10-K, Quarterly Reports on Form 10-Q, Current Reports on Form 8-K and any amendments to those reports filed or furnished pursuant to Section 13(a) or 15(d) of the Securities Exchange Act of 1934, as soon as practicable after we electronically file the material with or furnish it to the U.S. Securities and Exchange Commission (the “SEC”). The public may read or copy any document we file with the SEC at the SEC’s website, http://www.sec.gov (File No. 0-19582), or at the SEC’s Public Reference Room at 100 F Street, NE, Washington, D.C. 20549. The SEC can be reached at 1-800-SEC-0330 for further information on the operation of the Public Reference Room. Information contained on our website is neither part of nor incorporated by reference into this Form 10-K or any other report we file with or furnish to the SEC.
Various factors exist that could cause our actual results to differ materially from those projected in any forward-looking statement. In addition to the factors discussed elsewhere in this report, we believe the following are some of the important risks and uncertainties that could materially affect our business, financial condition or results of operations:
We operate in a highly competitive industry, and our business will suffer if we are unable to adequately address potential downward pricing pressures and other factors that may adversely affect our operations and profitability.
Numerous competitive factors could impair our ability to maintain our current profitability. These factors include, but are not limited to, the following:
| • | we compete with many other transportation service providers of varying sizes, some of which may have more equipment, a broader global network, a wider range of services, greater capital resources or other competitive advantages; |
| • | some of our competitors periodically reduce their prices to gain business, especially during times of reduced growth rates in the economy, which may limit our ability to maintain or increase prices or maintain revenue; |
| • | we may be unable to continue to collect fuel surcharges or our fuel surcharge program may become ineffective in mitigating the impact of fluctuating costs for fuel and other petroleum-based products; |
| • | many customers reduce the number of carriers they use by selecting “core carriers” as approved transportation service providers and we may not be selected; |
| • | many customers periodically accept bids from multiple carriers for their shipping needs, and this process may depress prices or result in the loss of some business to competitors; |
| • | some customers may choose to operate their own private trucking fleet or may choose to increase the volume of freight they transport if they have an existing private trucking fleet; |
| • | the trend towards consolidation in the ground transportation industry may create other large carriers with greater financial resources and other competitive advantages relating to their size; |
| • | advances in technology require increased investments to remain competitive, and our customers may not be willing to accept higher prices to cover the cost of these investments; and |
| • | competition from non-asset-based logistics and freight brokerage companies may adversely affect our customer relationships and ability to maintain sufficient pricing. |
If we are unable to effectively compete with other LTL carriers, whether on the basis of price, service or otherwise, we may be unable to retain existing customers or attract new customers, either of which could have a material adverse effect on our business, financial condition and results of operations.
7
If our employees were to unionize, our operating costs would increase and our ability to compete would be impaired.
None of our employees are currently represented under a collective bargaining agreement. However, from time to time there have been efforts to organize our employees at various service centers. Further, Congress or one or more states could approve legislation significantly affecting our business and our relationship with our employees, such as the proposed federal legislation referred to as the Employee Free Choice Act, which would substantially liberalize the procedures for union organization. In addition, we can offer no assurance that the Department of Labor will not adopt new regulations or interpret existing regulations in a manner that would favor the agenda of unions, or that our employees will not unionize in the future, particularly if regulatory changes occur that facilitate unionization.
The unionization of our employees could have a material adverse effect on our business, financial condition and results of operations because:
| • | some shippers have indicated that they intend to limit their use of unionized trucking companies because of the threat of strikes and other work stoppages; |
| • | restrictive work rules could hamper our efforts to improve and sustain operating efficiency; |
| • | restrictive work rules could impair our service reputation and limit our ability to provide next-day services; |
| • | a strike or work stoppage would negatively impact our profitability and could damage customer and employee relationships; and |
| • | an election and bargaining process could divert management’s time and attention from our overall objectives and impose significant expenses. |
If we are unable to successfully execute our growth strategy, our business and future results of operations may suffer.
Our growth strategy includes increasing the volume of freight moving through our existing service center network, selectively expanding our geographic footprint and broadening the scope of our service offerings. In connection with our growth strategy, at various times, we have made selective acquisitions, purchased additional equipment, expanded and upgraded service centers and increased our sales and marketing efforts, and we expect to continue to do so. Our growth strategy exposes us to a number of risks, including the following:
| • | geographic expansion requires start-up costs that could expose us to temporary losses; |
| • | growth and geographic expansion are dependent on the availability of real estate, and shortages of suitable real estate may limit our geographic expansion and might cause congestion in our service center network, which could result in increased operating expenses; |
| • | growth may strain our management, capital resources, information systems and customer service; |
| • | hiring new employees may increase training costs and may result in temporary inefficiencies until those employees become proficient in their jobs; and |
| • | expanding our service offerings may require us to enter into new markets and encounter new competitive challenges. |
We cannot assure that we will overcome the risks associated with our growth strategy. If we fail to overcome those risks, we may not realize additional revenue or profits from our efforts, we may incur additional expenses and, therefore, our financial position and results of operations could be materially and adversely affected.
We may be unable to successfully consummate and integrate acquisitions as part of our growth strategy.
Growth through acquisitions has been a key component of our LTL growth strategy throughout our history. In the future, we may seek to acquire other LTL carriers as well as other complementary businesses. Exploration of potential acquisitions requires significant attention from our senior management team. In addition, we expect to compete for acquisition opportunities with other companies, some of which may have greater financial and other resources than we do. We cannot assure that we will
8
have sufficient cash with which to consummate an acquisition or otherwise be able to obtain financing for any acquisition. If we are unable to access sufficient funding for potential acquisitions, we may not be able to complete transactions that we otherwise find advantageous.
Any subsequent acquisition will entail numerous risks, including:
| • | we may not achieve anticipated levels of revenue, efficiency, cash flows and profitability; |
| • | we may experience difficulties managing businesses that are outside our historical core competency and markets; |
| • | we may underestimate the resources required to support acquisitions, which could disrupt our ongoing business and distract our management; |
| • | we may incur unanticipated costs to our infrastructure to support new business lines or separate legal entities; |
| • | we may be required to temporarily match existing customer pricing in the acquiree’s markets, which may be lower than the rates that we would typically charge for our services; |
| • | liabilities we assume could be greater than our original estimates or not disclosed to us at the time of acquisition; |
| • | we may incur additional indebtedness or we may issue additional shares of stock to finance future acquisitions, which could be dilutive to our shareholders; |
| • | potential loss of key employees and customers of the acquired company; and |
| • | an inability to recognize projected cost savings and economies of scale. |
In addition, we may have difficulty integrating any acquired business and its operations, services and personnel into our existing operations, and such integration may require a significant amount of time and effort by our management team. To the extent we do not successfully avoid or overcome the risks or problems resulting from any acquisitions we undertake, there could be a material adverse effect on our business, financial condition and results of operations.
Our customers’ and suppliers’ business may be impacted by a downturn in the economy and/or a disruption of financial markets.
Adverse economic conditions can negatively affect our customers’ business levels, the amount of transportation services they need, their ability to pay for our services and overall freight levels, all of which might impair our asset utilization. Customers encountering adverse economic conditions may be unable to obtain additional financing, or financing under acceptable terms, due to disruptions in the capital and credit markets. These customers represent a greater potential for bad debt losses, which may require us to increase our reserve for bad debt. Economic conditions resulting in bankruptcies of one or more of our large customers could have a significant impact on our financial position, results of operations or liquidity in a particular year or quarter. Further, when adverse economic times arise customers may bid out freight or select competitors that offer lower rates from among existing choices in an attempt to lower their costs and we might be forced to lower our rates or lose freight.
Our suppliers’ business levels also may be negatively affected by adverse economic conditions or financial constraints, which could lead to disruptions in the supply and availability of equipment, parts and services critical to our operations. A significant interruption in our normal supply chain could disrupt our operations, increase our costs and negatively impact our ability to serve our customers.
We also are subject to cost increases outside our control that could materially reduce our profitability if we are unable to increase our rates sufficiently. Such cost increases include, but are not limited to, increases in fuel prices, driver wages, interest rates, taxes, tolls, license and registration fees, insurance, revenue equipment and healthcare for our employees.
Increases in driver compensation or other difficulties attracting and retaining qualified drivers could adversely affect our profitability and ability to maintain or grow our fleet.
From time to time we have experienced difficulty in attracting and retaining sufficient numbers of qualified drivers and such shortages may recur in the future. Because of the intense competition for drivers, we may face difficulty maintaining or increasing our number of drivers. The compensation we offer our drivers is subject to market conditions that may require increases in driver compensation, which
9
becomes more likely as economic conditions improve. If we are unable to attract and retain a sufficient number of drivers, we could be required to adjust our compensation packages, or operate with fewer trucks and face difficulty meeting shipper demands, all of which could adversely affect our profitability and ability to maintain our size or grow.
Insurance and claims expenses could significantly reduce our profitability.
We are exposed to claims related to cargo loss and damage, property damage, personal injury, workers’ compensation, long-term disability, group health and dental. We have insurance coverage with third-party insurance carriers, but self-insure for a significant portion of the risk associated with these claims. Our operating results would be adversely affected if any of the following were to occur: (i) the number or severity of claims for which we are self-insured increases; (ii) we are required to accrue or pay additional amounts because the claims prove to be more severe than our original assessment; or (iii) claims exceed our excess coverage amounts. If claims exceed our retention levels or insurance market conditions change, insurers could raise premiums for excess coverage to cover their expenses and anticipated future losses. In addition, insurance companies require us to obtain letters of credit to collateralize our self-insured retention. If these requirements increase, our borrowing capacity could be adversely affected.
We have significant ongoing cash requirements that could limit our growth and affect our profitability if we are unable to obtain sufficient capital.
Our business is highly capital intensive. We generally finance our capital expenditures and planned growth with existing cash, cash flow from operations, issuance of debt and through available borrowings under our existing senior unsecured credit agreement. We may require additional capital to finance long-term real estate purchase opportunities and acquisitions, which we may fund through additional debt or through equity offerings. If we are unable in the future to generate sufficient cash from our operations or raise capital by accessing the debt and equity markets, we may be forced to limit our growth and operate our equipment for longer periods of time, which could have a material adverse effect on our operating results.
Our business also has significant ongoing operating cash requirements. If our cash requirements are high or our cash flow from operations is low during particular periods, we may need to seek additional financing, which may be costly or difficult to obtain.
Limited supply and increased prices for new equipment may adversely affect our earnings and cash flow.
We may face difficulty in purchasing new equipment due to decreased supply and increased costs. Investment in new equipment is a significant part of our annual capital expenditures and we require an available supply of tractors and trailers from equipment manufacturers to operate and grow our business. We are also subject to shortages in raw materials that are required for the production of critical operating equipment and supplies, such as shortages in rubber or steel.
The price of our equipment may also be adversely affected in the future by regulations on newly manufactured tractors and diesel engines. We have incurred significant increases in the cost of tractors due to the U.S. Environmental Protection Agency’s (the “EPA”) regulations that require progressive reductions in exhaust emissions from diesel engines. Beginning in October 2002, new diesel engines were required to meet these new emission limits. Some of the regulations required reductions in the sulfur content of diesel fuel beginning in June 2006 and the introduction of emissions after-treatment devices on newly-manufactured engines and vehicles beginning with model-year 2007. The final phase of these regulations required reduced nitrogen and non-methane hydrocarbon emissions beginning with model-year 2010. These regulations have resulted in higher prices for tractors and diesel engines and increased operating and maintenance costs, and there can be no assurance that continued increases in pricing or costs will not have an adverse effect on our business and results of operations.
A decrease in the demand and value of used equipment may impact our results of operations.
As we purchase new tractors as part of our normal replacement cycle each year, we rely on the used equipment market to dispose of our older equipment. Oversupply in the transportation industry as well as
10
adverse domestic and foreign economic conditions can negatively impact the demand for used tractors and, therefore, reduce the value we can obtain on our used equipment. If we are unable to sell our older equipment at or above salvage value, the resulting losses could have a significant impact on our results of operations.
We may be adversely impacted by fluctuations in the availability and price of diesel fuel.
Diesel fuel is a critical component of our operations and a significant operating expense for our business. Diesel fuel prices and fuel availability can be impacted by factors beyond our control, such as natural or man-made disasters, political events, price and supply decisions by oil producing countries and cartels, terrorist activities, armed conflict and world supply and demand imbalances. We maintain fuel storage and pumping facilities at many of our service center locations; however, we may experience shortages in the availability of diesel fuel at certain locations and may be forced to incur additional expense to ensure adequate supply on a timely basis to prevent a disruption to our service schedules. An interruption in the supply of diesel fuel could have a material adverse effect on our operating results.
We do not hedge against the risk of diesel fuel price increases. An increase in diesel fuel prices or diesel fuel taxes, or any change in federal or state regulations that results in such an increase, could have a material adverse effect on our operating results. We have fuel surcharge programs in place with a majority of our customers, which have helped us offset the majority of the negative impact of the increased cost of diesel fuel and other petroleum-based products. However, we also incur fuel costs that cannot be recovered even with respect to customers with which we maintain fuel surcharge programs, such as those costs associated with empty miles, deadhead miles or the time when our engines are idling. Because our fuel surcharge recovery lags behind changes in fuel prices, our fuel surcharge recovery may not capture the increased costs we pay for fuel, especially when prices are rising, leading to fluctuations in our levels of reimbursement. We regularly monitor the components of our pricing, including fuel surcharges, and address individual account profitability issues with our customers when necessary; however, there can be no assurance that fuel surcharges can be maintained indefinitely or will be sufficiently effective in offsetting increases in diesel fuel prices.
We are subject to various environmental laws and regulations, and costs of compliance with, liabilities under, or violations of, existing or future environmental laws or regulations could adversely affect our business.
We are subject to various federal, state and local environmental laws and regulations that govern, among other things, the emission and discharge of hazardous materials into the environment, the presence of hazardous materials at our properties or in our vehicles, fuel storage tanks, the transportation of certain materials and the discharge or retention of storm water. Under certain environmental laws, we could also be held responsible for any costs relating to contamination at our past or present facilities and at third-party waste disposal sites, as well as costs associated with the clean-up of accidents involving our vehicles. Environmental laws have become and are expected to continue to be increasingly more stringent over time, and there can be no assurance that our costs of complying with current or future environmental laws or liabilities arising under such laws will not have a material adverse effect on our business, operations or financial condition.
In addition to the EPA regulations on exhaust emissions with which we must comply, there is an increased regulatory focus on climate change and greenhouse gas emissions in the United States. As a result, we may become subject to additional legislation or rulemaking that could adversely impact our business. Any future limitations on the emission of greenhouse gases or other environmental legislation could increase our future capital expenditures and have an adverse impact on our financial condition, results of operations and liquidity.
We operate in a highly regulated industry, and increased costs of compliance with, or liability for violation of, existing or future regulations could have a material adverse effect on our business.
We are regulated by the DOT and by various state agencies. These regulatory authorities have broad powers, generally governing matters such as authority to engage in motor carrier operations, as well as motor carrier registration, driver hours of service, safety and fitness of transportation equipment and drivers, transportation of hazardous materials, certain mergers and acquisitions and periodic financial reporting. In addition, the trucking industry is subject to regulatory and legislative changes from a variety
11
of other governmental authorities, which address matters such as: (i) increasingly stringent environmental, occupational safety and health regulations; (ii) limits on vehicle weight and size; (iii) ergonomics; (iv) port security; and (v) hours of service. In addition, we are subject to compliance with cargo-security and transportation regulations issued by the Transportation Security Administration within the U.S. Department of Homeland Security. Regulatory requirements, and changes in regulatory requirements, may affect our business or the economics of the industry by requiring changes in operating practices or by influencing the demand for and increasing the costs of providing transportation services.
In October 2009, the U.S. Court of Appeals for the District of Columbia Circuit ordered the FMCSA to review and re-issue rules governing hours of service for commercial truck drivers by July 26, 2011. This deadline was extended and on December 22, 2011, the FMCSA issued its final rule, which requires compliance by July 1, 2013. The final rule reduces the maximum number of hours a truck driver can work each week to 70 hours from the current 82-hour limit. The rule maintains the current maximum 11-hour daily driving limit, but requires drivers to take a 30-minute break prior to driving beyond eight hours. The rule also includes a “34-hour restart” provision that allows drivers to restart the clock on their work week by taking at least 34 consecutive hours off-duty, provided these 34 off-duty hours includes two periods between 1:00 a.m. and 5:00 a.m. and occurs only once during a seven-day period. We do not believe this new rule, when implemented, will have a significant impact on our operating procedures and will not significantly impact our costs. We are, however, subject to future rulemaking by the FMCSA and other regulatory agencies, which could be more stringent, require changes to our operations, increase our operating costs and otherwise adversely impact our results of operations.
The implementation of FMCSA’s Compliance, Safety, Accountability initiative (“CSA”) could adversely impact our ability to hire qualified drivers, meet our growth projections and maintain our customer relationships, each of which could adversely impact our results of operations.
In December 2010, the FMCSA began implementation of CSA, a new compliance and enforcement initiative designed to monitor and improve commercial motor vehicle safety. CSA measures both the safety record of the motor carrier and the driver. These measurements are scored and used by the FMCSA to identify potential safety risks and to direct enforcement action. CSA scores for transportation companies are currently available on the FMCSA’s website and will eventually replace SafeStat, the FMCSA’s former safety measurement system.
Our CSA scores are dependent upon our safety and compliance experience, which could change at any time. In addition, the safety standards prescribed in CSA could change and our ability to maintain an acceptable score could be adversely impacted. If we receive an unacceptable CSA score, our relationships with our customers could be damaged, which could result in a loss of business.
The implementation of CSA could also shrink the industry’s pool of drivers as those with unfavorable scores could leave the industry. As a result, the costs to attract, train and retain qualified drivers could increase. In addition, a shortage of qualified drivers could increase driver turnover, decrease asset utilization, limit growth and adversely impact our results of operations.
Our results of operations may be affected by seasonal factors and harsh weather conditions.
Our operations are subject to seasonal trends common in the trucking industry. Our operating margins in the first quarter are normally lower due to reduced demand during the winter months. Harsh weather can also adversely affect our performance by reducing demand and reducing our ability to transport freight, which could result in decreased revenue and increased operating expenses.
If we are unable to retain our key employees, our financial condition, results of operations and liquidity could be adversely affected.
Our success will continue to depend upon the experience and leadership of our key employees and executive officers. In that regard, the loss of the services of any of our key personnel could have a material adverse effect on our financial condition, results of operations and liquidity.
12
Our principal shareholders control a large portion of our outstanding common stock.
Earl E. Congdon, David S. Congdon, John R. Congdon and members of their respective families beneficially own an aggregate of approximately 27% of the outstanding shares of our common stock. As long as the Congdon family controls a large portion of our voting stock, they may be able to significantly influence the election of the entire Board of Directors and the outcome of all matters involving a shareholder vote. The Congdon family’s interests may differ from the interests of other shareholders and the status of their ownership could change at their discretion.
Our financial results may be adversely impacted by potential future changes in accounting practices.
Future changes in accounting standards or practices, and related legal and regulatory interpretations of those changes, may adversely impact public companies in general, the transportation industry or our operations specifically. New accounting standards or requirements, such as a conversion from U.S. generally accepted accounting principles to International Financial Reporting Standards, could change the way we record revenues, expenses, assets and/or liabilities or could be costly to implement. These types of regulations could have a negative impact on our financial position, liquidity, results of operations and/or access to capital.
Our information technology systems are subject to certain risks that we cannot control.
We have become increasingly reliant on our information systems for our operations as well as providing a value-added service to our customers. Our information systems, including our accounting systems, are dependent upon third-party software, global communications providers, data network systems and other aspects of technology and Internet infrastructure that are susceptible to failure or an adverse cyber incident. Although we have implemented redundant systems and network security measures, our information technology remains susceptible to outages, computer viruses, break-ins and similar disruptions. Such an event could inhibit our ability to provide services to our customers and the ability of our customers to access our systems. In addition, there could be a loss of confidential information, corruption of data and damage to our brand image. This may result in a reduction in demand for our services or the loss of customers that could have a negative impact on our financial condition, results of operations and liquidity.
If we raise additional capital in the future, your ownership in us could be diluted.
Any issuance of equity we may undertake in the future to raise additional capital could cause the price of our common stock to decline, or require us to issue shares at a price that is lower than that paid by holders of our common stock in the past, which would result in those newly issued shares being dilutive. If we obtain funds through a credit facility or through the issuance of debt or preferred securities, these obligations and securities would likely have rights senior to your rights as a common shareholder, which could impair the value of our common stock.
The market value of our common stock may fluctuate and could be substantially affected by various factors.
The price of our common stock on the NASDAQ Global Select Market, or Nasdaq, constantly changes. We expect that the market price of our common stock will continue to fluctuate. Our share price may fluctuate as a result of a variety of factors, many of which are beyond our control. These factors include, among others:
| • | Actual or anticipated variations in earnings, financial or operating performance or liquidity; |
| • | Changes in analysts’ recommendations or projections; |
| • | Failure to meet analysts’ projections; |
| • | General economic and capital market conditions; |
| • | Announcements of developments related to our business; |
| • | Operating and stock performance of other companies deemed to be peers; |
| • | Actions by government regulators; and |
| • | News reports of trends, concerns and other issues related to us or our industry, including changes in regulations. |
13
Our common stock price may fluctuate significantly in the future, and these fluctuations may be unrelated to our performance. General market price declines or market volatility in the future could adversely affect the price of our common stock, and the current market price of our common stock may not be indicative of future market prices.
Our articles of incorporation, our bylaws and Virginia law contain provisions that could discourage, delay or prevent a change in our control or our management.
Provisions of our articles of incorporation, bylaws and the laws of Virginia, the state in which we are incorporated, may discourage, delay or prevent a change in control of us or a change in management that shareholders may consider favorable. These provisions:
| • | limit who may call a special meeting of shareholders; |
| • | require shareholder action by written consent to be unanimous; |
| • | establish advance notice requirements for nominations for election to our Board of Directors or for proposing matters that can be acted upon at shareholder meetings; |
| • | may make it difficult to merge with or otherwise absorb a Virginia corporation acquired in a tender offer for the three years after the acquisition; and |
| • | may make an unsolicited attempt to gain control of us more difficult by restricting the right of specified shareholders to vote newly acquired large blocks of stock. |
These provisions could discourage proxy contests and make it more difficult for you and other shareholders to take certain corporate actions. These provisions could also limit the price that investors might be willing to pay in the future for shares of our common stock.
ITEM 1B. UNRESOLVED STAFF COMMENTS
None.
We own our general office located in Thomasville, North Carolina, consisting of a two-story office building of approximately 160,000 square feet on 30.1 acres of land. At December 31, 2011, we operated 216 service centers, of which 139 were owned and 77 were leased. Our service centers that are owned include most of our larger facilities and account for 79.8% of the total door capacity in our network. With the exception of our Chicago, Illinois facility, which has a lease that expires in 2021, we own our major breakbulk facilities. Each of our breakbulk facilities is listed below with the number of doors as of December 31, 2011.
| Service Center |
Doors | |
| Harrisburg, Pennsylvania |
305 | |
| Rialto, California |
265 | |
| Morristown, Tennessee |
247 | |
| Dallas, Texas |
234 | |
| Atlanta, Georgia |
227 | |
| Indianapolis, Indiana |
223 | |
| Greensboro, North Carolina |
219 | |
| Memphis, Tennessee |
169 | |
| Chicago, Illinois |
134 | |
| Salt Lake City, Utah |
129 |
Our 216 facilities are strategically dispersed over the states in which we operate. At December 31, 2011, the terms of our leased properties ranged from month-to-month to a lease that expires in 2023. We believe that as current leases expire, we will be able to renew them or find comparable facilities without incurring any material negative impact on service to our customers or our operating results.
We also own 21 non-operating properties, all of which are held for lease or are planned for future use. Seven of these properties are leased with lease terms that range from month-to-month to a lease that expires in 2013.
14
We believe that all of our properties are in good repair and are capable of providing the level of service required by current business levels and customer demands. In addition, we believe we have sufficient capacity in our service center network to accommodate a substantial increase in demand for our services.
We are involved in various legal proceedings and claims that have arisen in the ordinary course of our business that have not been fully adjudicated. Many of these are covered in whole or in part by insurance. Our management does not believe that these actions, when finally concluded and determined, will have a material adverse effect upon our financial position, liquidity or results of operations.
ITEM 4. MINE SAFETY DISCLOSURES
Not applicable.
15
ITEM 5. MARKET FOR REGISTRANT’S COMMON EQUITY, RELATED STOCKHOLDER MATTERS AND ISSUER PURCHASES OF EQUITY SECURITIES
Common Stock and Dividend Information
Our common stock is traded on the NASDAQ Global Select Market, which we refer to as the Nasdaq, under the symbol ODFL. At February 17, 2012, there were approximately 20,766 holders of our common stock, including 174 shareholders of record. We did not pay any dividends on our common stock during fiscal year 2011 or 2010, and we have no current plans to declare or pay any dividends on our common stock during fiscal year 2012. For information concerning restrictions on our ability to make dividend payments, see Liquidity and Capital Resources in Item 7, “Management’s Discussion and Analysis of Financial Condition and Results of Operations” and Note 2 in Item 8, “Financial Statements and Supplementary Data” of this report.
On July 30, 2010, our Board of Directors approved a three-for-two common stock split for shareholders of record as of the close of business on August 9, 2010. On August 23, 2010, those shareholders received one additional share of common stock for every two shares owned. In lieu of fractional shares, shareholders received a cash payment based on the average of the high and low sales prices of the common stock on the record date.
The following table sets forth the high and low sales price of our common stock for the periods indicated, as reported by the Nasdaq and as adjusted to give effect to the three-for-two stock split effected in August 2010:
| 2011 | ||||||||||||||||
| First Quarter |
Second Quarter |
Third Quarter |
Fourth Quarter |
|||||||||||||
| High |
$ | 35.31 | $ | 38.47 | $ | 40.12 | $ | 41.60 | ||||||||
| Low |
$ | 28.37 | $ | 33.62 | $ | 27.75 | $ | 27.40 | ||||||||
| 2010 | ||||||||||||||||
| First Quarter |
Second Quarter |
Third Quarter |
Fourth Quarter |
|||||||||||||
| High |
$ | 23.07 | $ | 25.89 | $ | 27.29 | $ | 32.24 | ||||||||
| Low |
$ | 17.56 | $ | 21.02 | $ | 22.45 | $ | 24.36 | ||||||||
16
Performance Graph
The following graph compares the total shareholder cumulative returns, assuming the reinvestment of all dividends, of $100 invested on December 31, 2006, in (i) our common stock, (ii) the NASDAQ Trucking & Transportation Stocks and (iii) The NASDAQ Stock Market (US) for the five-year period ended December 31, 2011:
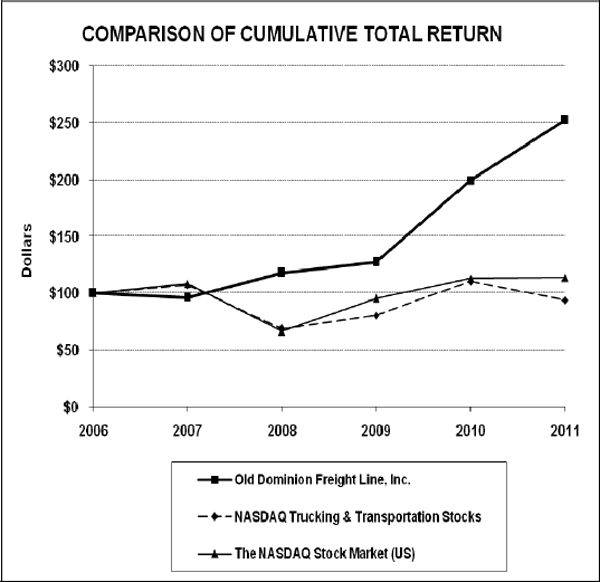
Cumulative Total Return
| 12/31/06 | 12/31/07 | 12/31/08 | 12/31/09 | 12/31/10 | 12/31/11 | |||||||||||||||||||
| Old Dominion Freight Line, Inc...................................................... |
$ | 100 | $ | 96 | $ | 118 | $ | 128 | $ | 199 | $ | 253 | ||||||||||||
| NASDAQ Trucking & Transportation Stocks................................ |
$ | 100 | $ | 107 | $ | 69 | $ | 81 | $ | 111 | $ | 94 | ||||||||||||
| The NASDAQ Stock Market (US).................................................. |
$ | 100 | $ | 108 | $ | 66 | $ | 95 | $ | 113 | $ | 114 | ||||||||||||
17
ITEM 6. SELECTED FINANCIAL DATA
| Year Ended December 31, | ||||||||||||||||||||
| (In thousands, except per share amounts and operating statistics) |
2011 | 2010 | 2009 | 2008 | 2007 | |||||||||||||||
| Operating Data: |
||||||||||||||||||||
| Revenue from operations |
$ | 1,882,541 | $ | 1,480,998 | $ | 1,245,005 | $ | 1,537,724 | $ | 1,401,542 | ||||||||||
| Depreciation and amortization expense (1) |
90,820 | 80,362 | 94,784 | 87,083 | 79,863 | |||||||||||||||
| Total operating expenses |
1,648,469 | 1,343,259 | 1,174,614 | 1,408,654 | 1,271,605 | |||||||||||||||
| Operating income |
234,072 | 137,739 | 70,391 | 129,070 | 129,937 | |||||||||||||||
| Interest expense, net (2) |
13,887 | 12,465 | 12,998 | 13,012 | 12,960 | |||||||||||||||
| Provision for income taxes |
80,614 | 48,775 | 22,294 | 43,989 | 43,963 | |||||||||||||||
| Net income |
139,470 | 75,651 | 34,871 | 68,677 | 71,832 | |||||||||||||||
| Per Share Data: |
||||||||||||||||||||
| Diluted earnings per share (3) |
2.44 | 1.35 | 0.62 | 1.23 | 1.28 | |||||||||||||||
| Balance Sheet Data: |
||||||||||||||||||||
| Cash, cash equivalents and short-term investments |
75,850 | 5,450 | 4,171 | 28,965 | 30,703 | |||||||||||||||
| Current assets |
331,852 | 222,582 | 174,175 | 209,230 | 216,277 | |||||||||||||||
| Total assets |
1,513,074 | 1,239,881 | 1,159,278 | 1,074,905 | 981,048 | |||||||||||||||
| Current liabilities |
204,810 | 170,046 | 148,125 | 142,190 | 127,723 | |||||||||||||||
| Long-term debt (including current maturities) |
269,185 | 271,217 | 305,532 | 251,989 | 263,754 | |||||||||||||||
| Shareholders’ equity |
856,519 | 668,649 | 593,000 | 558,129 | 489,452 | |||||||||||||||
| Operating Statistics: |
||||||||||||||||||||
| Operating ratio |
87.6 | % | 90.7 | % | 94.3 | % | 91.6 | % | 90.7 | % | ||||||||||
| Revenue per hundredweight |
$ | 14.72 | $ | 13.09 | $ | 12.70 | $ | 13.88 | $ | 13.30 | ||||||||||
| Revenue per intercity mile |
$ | 4.83 | $ | 4.38 | $ | 4.16 | $ | 4.60 | $ | 4.31 | ||||||||||
| Intercity miles (in thousands) |
389,588 | 338,504 | 299,330 | 334,219 | 325,268 | |||||||||||||||
| Total tons (in thousands) |
6,397 | 5,656 | 4,902 | 5,545 | 5,271 | |||||||||||||||
| Total shipments (in thousands) |
7,256 | 6,327 | 5,750 | 6,691 | 6,765 | |||||||||||||||
| Average length of haul (4) (miles) |
952 | 948 | 928 | 901 | 926 | |||||||||||||||
| (1) | Our 2010 results reflect reductions in our depreciation and amortization expenses of approximately $12.7 million, due to changes in the estimated useful lives and salvage values of certain equipment, which are described further under “Critical Accounting Policies” below. |
| (2) | For the purpose of this table, interest expense is presented net of interest income. |
| (3) | Per share data has been restated retroactively for the three-for-two stock split effected in August 2010. |
| (4) | We refined our average length of haul in 2008 by excluding miles driven by our agent carriers. As a result, our average length of haul is restated for the year ended December 31, 2007. |
ITEM 7. MANAGEMENT’S DISCUSSION AND ANALYSIS OF FINANCIAL CONDITION AND RESULTS OF OPERATIONS
Overview
We are a leading, less-than-truckload (“LTL”), union-free motor carrier providing regional, inter-regional and national LTL service and value-added logistics services from a single integrated organization. In addition to our core LTL services, we offer our customers a broad range of logistics services including ground and air expedited transportation, supply chain consulting, transportation management, truckload brokerage, container delivery and warehousing services, as well as consumer household moving services. Through marketing and carrier relationships, we also offer door-to-door international freight services to and from all of North America, Central America, South America and the Far East. Approximately 90% of our revenue has historically been derived from transporting LTL shipments for our customers, whose demand for our services is generally tied to industrial production and the overall health of the U.S. domestic economy.
18
In analyzing the components of our revenue, we monitor changes and trends in the following key metrics:
| • | Revenue Per Hundredweight – This measurement reflects our pricing policies, which are influenced by competitive market conditions and our growth objectives. Generally, freight is rated by a class system, which is established by the National Motor Freight Traffic Association, Inc. Light, bulky freight typically has a higher class and is priced at higher revenue per hundredweight than dense, heavy freight. Changes in the class, packaging of the freight and length of haul of the shipment can also affect this average. Fuel surcharges, accessorial charges, revenue adjustments and revenue for undelivered freight are included in this measurement. Revenue for undelivered freight is deferred for financial statement purposes in accordance with our revenue recognition policy; however, we believe including it in our revenue per hundredweight measurements results in a better indicator of changes in our yields by matching total billed revenue with the corresponding weight of those shipments. |
| • | Weight Per Shipment – Fluctuations in weight per shipment can indicate changes in the class, or mix, of freight we receive from our customers, as well as changes in the number of units included in a shipment. Generally, increases in weight per shipment indicate higher demand for our customers’ products and overall increased economic activity. |
| • | Average Length of Haul – We consider lengths of haul less than 500 miles to be regional traffic, lengths of haul between 500 miles and 1,000 miles to be inter-regional traffic, and lengths of haul in excess of 1,000 miles to be national traffic. By analyzing this metric, we can determine the success and growth potential of our service products in these markets. |
| • | Revenue Per Shipment – This measurement is primarily determined by the three metrics listed above and is used, in conjunction with the number of shipments we receive, to calculate total revenue, excluding adjustments for undelivered freight. |
Our primary revenue focus is to increase shipment and tonnage growth within our existing infrastructure, generally referred to as increasing density, thereby maximizing asset utilization and labor productivity. We measure density over many different functional areas of our operations including revenue per service center, linehaul load factor, P&D stops per hour, P&D shipments per hour, platform pounds handled per hour and platform shipments per hour. In addition to our focus on density, it is critical for us to obtain an appropriate yield on the shipments we handle. We manage our yields by focusing on individual account profitability. We believe yield management and improvements in density are key components in our ability to produce profitable growth.
Our primary cost elements are direct wages and benefits associated with the movement of freight; operating supplies and expenses, which includes fuel and equipment repair costs; and depreciation of our equipment fleet and service center facilities. We gauge our overall success in managing these costs by monitoring our operating ratio, a measure of profitability calculated by dividing total operating expenses by revenue, which also allows industry-wide comparisons with our competition.
We continually upgrade our technological capabilities to improve our customer service and lower our operating costs. Our technology provides our customers with visibility of their shipments throughout our network, increases the productivity of our workforce and provides key metrics from which we can monitor our processes.
19
Results of Operations
The following table sets forth, for the years indicated, expenses and other items as a percentage of revenue from operations:
| 2011 | 2010 | 2009 | ||||||||||
| Revenue from operations |
100.0 | % | 100.0 | % | 100.0 | % | ||||||
|
|
|
|
|
|
|
|||||||
| Operating expenses: |
||||||||||||
| Salaries, wages and benefits |
50.8 | 54.6 | 57.7 | |||||||||
| Operating supplies and expenses |
18.9 | 16.5 | 14.6 | |||||||||
| General supplies and expenses |
2.6 | 2.8 | 2.8 | |||||||||
| Operating taxes and licenses |
3.4 | 3.8 | 4.0 | |||||||||
| Insurance and claims |
1.5 | 1.7 | 1.8 | |||||||||
| Communication and utilities |
1.0 | 1.0 | 1.2 | |||||||||
| Depreciation and amortization |
4.8 | 5.4 | 7.6 | |||||||||
| Purchased transportation |
3.4 | 3.4 | 2.7 | |||||||||
| Building and office equipment rents |
0.7 | 1.0 | 1.2 | |||||||||
| Miscellaneous expenses, net |
0.5 | 0.5 | 0.7 | |||||||||
|
|
|
|
|
|
|
|||||||
| Total operating expenses |
87.6 | 90.7 | 94.3 | |||||||||
|
|
|
|
|
|
|
|||||||
| Operating income |
12.4 | 9.3 | 5.7 | |||||||||
| Interest expense, net (1) |
0.7 | 0.8 | 1.1 | |||||||||
| Other expense, net |
0 | 0.1 | 0 | |||||||||
|
|
|
|
|
|
|
|||||||
| Income before income taxes |
11.7 | 8.4 | 4.6 | |||||||||
| Provision for income taxes |
4.3 | 3.3 | 1.8 | |||||||||
|
|
|
|
|
|
|
|||||||
| Net income |
7.4 | % | 5.1 | % | 2.8 | % | ||||||
|
|
|
|
|
|
|
|||||||
| (1) | For the purpose of this table, interest expense is presented net of interest income. |
20
2011 Compared to 2010
Key financial and operating metrics for 2011 and 2010 are presented below:
| 2011 | 2010 | Change | % Change | |||||||||||||
| Work days |
254 | 253 | 1 | 0.4 | ||||||||||||
| Revenue (in thousands) |
$ | 1,882,541 | $ | 1,480,998 | $ | 401,543 | 27.1 | |||||||||
| Operating ratio |
87.6 | % | 90.7 | % | (3.1 | )% | (3.4 | ) | ||||||||
| Net income (in thousands) |
$ | 139,470 | $ | 75,651 | $ | 63,819 | 84.4 | |||||||||
| Diluted earnings per share |
$ | 2.44 | $ | 1.35 | $ | 1.09 | 80.7 | |||||||||
| Total tons (in thousands) |
6,397 | 5,656 | 741 | 13.1 | ||||||||||||
| Total shipments (in thousands) |
7,256 | 6,327 | 929 | 14.7 | ||||||||||||
| Weight per shipment (lbs.) |
1,763 | 1,788 | (25 | ) | (1.4 | ) | ||||||||||
| Revenue per hundredweight |
$ | 14.72 | $ | 13.09 | $ | 1.63 | 12.5 | |||||||||
| Revenue per shipment |
$ | 259.50 | $ | 234.09 | $ | 25.41 | 10.9 | |||||||||
| Average length of haul (miles) |
952 | 948 | 4 | 0.4 | ||||||||||||
Our financial results for 2011 were the best we have produced in our 20 years as a public company and extended the momentum we built in 2010. We experienced strong growth in both tonnage and revenue per hundredweight, and we improved our productivity, all of which led to significant margin improvement. Tonnage growth in 2011 was primarily the result of our ability to win market share as well as a slight improvement in the overall U.S. economy. We believe our consistent strategy of providing “best-in-class” on-time and claims-free service at a fair and equitable price resonates with shippers and will continue to help us win market share and fuel our growth. Our ability to win market share is supported by our belief that shippers are making decisions based more on the overall value of the service they receive than focusing simply on prices. This change in philosophy occurred as many of our competitors implemented significant rate increases in 2011 and 2010. While we implemented a modest rate increase in 2011, we do not believe we have the headwinds that many of our competitors will face in making pricing decisions in 2012. As a result, we believe the quality of our service and the consistency of our pricing is a winning strategy that will continue to provide opportunities for us to increase tonnage and market share in 2012.
The increase in revenue during 2011, as well as productivity improvements, enabled us to leverage our fixed cost network and generate significant improvement in our operating results. Our net income increased in 2011 by $63.8 million, or 84.4%, to $139.5 million and our operating ratio decreased by 310 basis points to 87.6%, which is the best annual operating ratio produced in our Company’s history.
Revenue
The 27.1% increase in revenue during 2011 was the result of increases in both tonnage and revenue per hundredweight. Tonnage increased 13.1% due to a 14.7% increase in shipments that was partially offset by a 1.4% decrease in weight per shipment. While a decrease in weight per shipment has historically been an indicator of weakness in the economy, we believe the decrease we experienced in 2011 was due to a decline in the number of heavier non-traditional LTL shipments, such as full-container load and truckload shipments, as a percent of our total shipments.
Revenue per hundredweight increased 12.5% to $14.72 in 2011. This change reflects a much improved LTL pricing environment that supported our rate increases, as well as an increase in fuel surcharges. Our fuel surcharges are designed to offset fluctuations in the cost of petroleum-based products and are one of many components included in the overall price for our services. Revenue per hundredweight is a good indicator of pricing trends, but this metric is influenced by many other factors, such as changes in fuel surcharges, weight per shipment, length of haul and mix of freight; therefore, changes in revenue per hundredweight do not necessarily indicate actual changes in underlying rates. Our revenue per hundredweight, excluding fuel surcharges, increased 7.1% in 2011 but was positively influenced by the decrease in weight per shipment and an increase in length of haul.
Fuel surcharge revenue increased to 16.4% of revenue from 12.3% in 2010 due to the increased price of diesel fuel during 2011. Most of our tariffs and contracts provide for a fuel surcharge, which is recorded as additional revenue, as diesel fuel prices increase above stated levels. These levels are
21
generally indexed to the DOE’s published fuel prices that reset each week. The fuel surcharge is one of many components included in the overall negotiated price for our transportation services with our customers, although it is generally considered to be a measure of the increase in cost of all petroleum products we use. We regularly monitor the components of our pricing, including base freight rates and fuel surcharges. We also address any individual account profitability issues with our customers as part of our effort to minimize the negative impact on our profitability that would likely result from a rapid and significant change in any of our operating expenses.
Operating Costs and Other Expenses
Salaries, wages and benefits increased $147.3 million or 18.2% in 2011, which compares favorably with our revenue growth of 27.1%. As a result, our salaries, wages and benefits improved to 50.8% of revenue from 54.6% in 2010. Salaries and wages, excluding benefits, increased $109.9 million due to a 7.6% increase in the total number of full-time employees and the impact from salary and wage increases provided to our employees in September 2011 and 2010. In addition, there was an increase in performance-based compensation due to the improvement in our financial and operational results. These increases were partially offset by the improved productivity of our linehaul, P&D and platform operations that resulted from increased density and a continued focus on efficiency. Our linehaul laden load average, P&D shipments per hour and platform pounds handled per hour improved 0.3%, 1.1% and 0.1%, respectively.
Employee benefit costs increased $37.3 million primarily due to an increase in the number of full-time employees, increased costs related to our group health plan and higher payroll-related taxes. As a percentage of salaries and wages, employee benefit costs increased slightly to 31.9% in 2011 from 31.5% in 2010. Our group health plan requires a 90-day waiting period before newly hired employees are eligible to enroll. A significant number of employees were hired in the second half 2010, and as a result, our group health costs increased as these new employees began to enroll in our plan in 2011. In addition, our group health costs increased due to changes required by the 2010 Patient Protection and Affordable Care Act, which required us to provide dependant coverage until the age of 26.
Operating supplies and expenses increased to 18.9% of revenue in 2011 from 16.5% in 2010. This increase is primarily due to the increase in diesel fuel costs, excluding fuel taxes, which is the largest component of operating supplies and expenses. These costs increased 52.8% during the year as a result of the combined effect of a 29.7% increase in our average price per gallon and a 12.7% increase in gallons consumed. The increase in fuel consumption is primarily due to a 14.7% year-over-year increase in overall miles driven that was partially offset by an improvement in our average miles per gallon. Our increased fuel consumption also resulted in an increase in our fuel tax expenses and was the principal driver of the $7.9 million increase in “Operating taxes and licenses.” We do not use diesel fuel hedging instruments and are therefore subject to market price fluctuations.
Depreciation and amortization expense decreased to 4.8% of revenue in 2011 as compared to 5.4% in 2010. Although our capital expenditure requirements increased in 2011, we were able to offset the cost of these additions by utilizing the available capacity of our fleet and service center network to create operating leverage on the 13.1% increase in tonnage. Our capital expenditure plan for 2012 is projected to be higher than 2011 and, as a result, our depreciation costs will likely increase in future periods.
We purchase linehaul transportation and P&D services from other motor carriers and railroads. We also utilize independent contractors for our container operations. We utilize these services when it is economically beneficial or when there are imbalances of freight flow within our service center network. Purchased transportation expense remained consistent at 3.4% of revenue in 2011 and 2010. As it is typically more efficient and profitable for us to utilize our own personnel and equipment, we expect to continue to focus on balancing our internal resources with freight demand in an effort to reduce our use of purchased transportation in future periods.
Our effective tax rate for 2011 was 36.6% as compared to 39.2% in 2010. Our effective tax rates in 2011 and 2010 were favorably impacted by alternative fuel tax credits for the use of propane in our operations. These fuel tax credits were originally scheduled to expire on December 31, 2009; however, they were extended to December 31, 2011 with the passage of the Tax Relief, Unemployment Insurance Reauthorization, and Job Creation Act of 2010. Our 2011 rate also includes the favorable impact of tax credits related to our investment in alternative energy-producing assets.
22
2010 Compared to 2009
Key financial and operating metrics for 2010 and 2009 are presented below:
| 2010 | 2009 | Change | % Change | |||||||||||||
| Work days |
253 | 253 | 0 | 0 | ||||||||||||
| Revenue (in thousands) |
$ | 1,480,998 | $ | 1,245,005 | $ | 235,993 | 19.0 | |||||||||
| Operating ratio |
90.7 | % | 94.3 | % | (3.6 | )% | (3.8 | ) | ||||||||
| Net income (in thousands) |
$ | 75,651 | $ | 34,871 | $ | 40,780 | 116.9 | |||||||||
| Diluted earnings per share |
$ | 1.35 | $ | 0.62 | $ | 0.73 | 117.7 | |||||||||
| Total tons (in thousands) |
5,656 | 4,902 | 754 | 15.4 | ||||||||||||
| Total shipments (in thousands) |
6,327 | 5,750 | 577 | 10.0 | ||||||||||||
| Weight per shipment (lbs.) |
1,788 | 1,705 | 83 | 4.9 | ||||||||||||
| Revenue per hundredweight |
$ | 13.09 | $ | 12.70 | $ | 0.39 | 3.1 | |||||||||
| Revenue per shipment |
$ | 234.09 | $ | 216.49 | $ | 17.60 | 8.1 | |||||||||
| Average length of haul (miles) |
948 | 928 | 20 | 2.2 | ||||||||||||
During 2010 we achieved significant increases in our shipments and tonnage, which accelerated during the second half of the year. We believe these increases were the result of our ability to gain market share during the year as well as general growth in U.S. industrial production and manufacturing. As industry capacity tightened in 2010, many of our competitors implemented significant rate increases. This reversed an industry trend of several years in which many of our competitors had discounted prices. While we implemented a modest general rate increase in November 2010, our pricing philosophy remained consistent with our strategy throughout the recession, which was to provide “best-in-class” on-time and claims-free service at a fair and equitable price.
The significant growth in our tonnage resulted in increased density in our network that generally resulted in increased efficiency and productivity. The overall improvement in our pricing during 2010, combined with the increased density, resulted in improvements in our operating results. Net income increased in 2010 by $40.8 million, or 116.9%, to $75.7 million and our operating ratio decreased by 360 basis points to 90.7%. Our 2010 results also reflect reductions in our depreciation and amortization expenses of approximately $12.7 million, due to changes in the estimated useful lives and salvage values of certain equipment, which are described further under “Critical Accounting Policies” below.
Revenue
The 19.0% increase in revenue during 2010 was the result of increases in tonnage and revenue per hundredweight. Tonnage increased 15.4% for the year ended December 31, 2010, due to the combination of a 10.0% increase in shipments and a 4.9% increase in weight per shipment. The growth in tonnage per day and shipments per day accelerated during the second half of the year, which we believe reflects our gain in market share as well as general economic improvement. We believe the increase in our weight per shipment during this time indicated an improving economy, although we also continued to gain market share with large national shippers that typically have heavier shipments.
Revenue per hundredweight increased 3.1% to $13.09 from $12.70 in 2009. This increase primarily reflects an increase in fuel surcharges, which are designed to offset fluctuations in the cost of petroleum-based products and are one of many components included in the overall price for our services. Excluding fuel surcharges, revenue per hundredweight remained consistent between 2010 and 2009 despite the negative effect on this metric from the increase in weight per shipment. This consistency reflects our ability to initiate price increases during 2010. As industry conditions improved during the year, our ability to obtain price increases strengthened. We experienced improvement in the year-over-year change in revenue per hundredweight, excluding fuel surcharges, for each month during the second half of 2010 and also implemented a general rate increase on certain of our tariffs effective November 15, 2010.
Fuel surcharge revenue increased to 12.3% of revenue from 9.6% in 2009, as a result of the increased price of diesel fuel during 2010. Most of our tariffs and contracts provide for a fuel surcharge, which is recorded as additional revenue, as diesel fuel prices increase above stated levels. These levels are generally indexed to the DOE’s published fuel prices that reset each week. The fuel surcharge is one
23
of many components included in the overall negotiated price for our transportation services with our customers, although it is generally considered to be a measure of the increase in cost of all petroleum products we use. We regularly monitor the components of our pricing, including base freight rates and fuel surcharges. We also address individual account profitability issues with our customers when necessary as part of our effort to minimize the negative impact on our profitability that would likely result from a rapid and significant change in any of our operating expenses.
Operating Costs and Other Expenses
Salaries, wages and benefits increased $90.1 million or 12.5 % in 2010, which compares favorably with our revenue and tonnage growth of 19.0% and 15.4%, respectively. As a result, and due to our increased reliance on purchased transportation in 2010, our salaries, wages and benefits improved to 54.6% of revenue from 57.7% in 2009. Salaries and wages increased $76.1 million due to a 16.4% increase in the total number of full-time employees and an increase in the number of hours worked by existing employees, which was in direct response to the increase in tonnage during the year. In addition, we implemented a 2% salary and wage increase for all employees on September 3, 2010.
The increased density within our network allowed us to leverage the additional volumes at lower unit costs. Driver wages as a percentage of revenue improved to 21.7% from 23.1% in 2009 and platform wages improved to 6.6% of revenue from 6.8% in 2009. The increased density also allowed us to maintain efficient operations, although we did not experience improvement in all of our productivity measures due to the costs of hiring and training new employees. In our linehaul operations, our laden load average increased 1.5%. P&D shipments per hour remained consistent with 2009, but our P&D stops per hour decreased 0.7%.
We benefited from a decrease in employee benefit costs as a percentage of salaries and wages to 31.5% in 2010 from 33.4% in 2009. Much of this improvement is attributable to the improvement in our group health and dental costs as a percent of salaries and wages. Our group health costs were favorably impacted by a decrease in the number of claims paid for participants under the Consolidated Omnibus Budget Reconciliation Act of 1985 (“COBRA”) and an overall decrease in the average severity of health insurance claims. There is also a 90-day wait period before newly hired employees are eligible to enroll in our health plan and the majority of the employees hired in 2010 were hired during the second half of the year. As a result, our group health costs are likely to increase in future periods as these new employees begin to enroll in our plan.
Operating supplies and expenses increased to 16.5% of revenue in 2010 from 14.6% in 2009. This increase is primarily due to the increase in diesel fuel costs, excluding fuel taxes, which is the largest component of operating supplies and expenses. These costs increased 44.5% during the year as a result of the combined effect of a 22.7% increase in our average price per gallon and a 12.1% increase in gallons consumed. The increase in fuel consumption is primarily due to the year-over-year increase in overall miles. Our increased consumption also resulted in the increase to our fuel tax expenses and was the principal driver of the $5.2 million increase in “Operating taxes and licenses.” We do not use diesel fuel hedging instruments and are therefore subject to market price fluctuations.
Depreciation and amortization expense decreased to 5.4% of revenue in 2010 as compared to 7.6% in 2009. Our capital expenditure requirements were reduced for 2010 due to the available capacity throughout the year in our fleet and service center network. The operating leverage created by our reduced capital expenditures and the 15.4% increase in tonnage contributed to the decrease in depreciation and amortization expense as a percent of revenue. The improvement as a percent of revenue also reflects the approximate $12.7 million decrease in depreciation expense that resulted from changes in the estimated useful lives and salvage values of certain equipment, effective January 1, 2010. The changes we made are described in more detail under “Critical Accounting Policies” below.
We purchase linehaul transportation and P&D services from other motor carriers and railroads. We also utilize independent contractors for our container operations. We utilize these services when it is economically beneficial or when there are imbalances of freight flow within our service center network. Purchased transportation expense increased to 3.4% of revenue in 2010 from 2.7% in 2009. These costs increased primarily because of certain imbalances of freight flow within our network, which is attributable to the significant increase in our tonnage. In response to our tonnage growth, we increased our full-time headcount during 2010, the majority of which were drivers and platform employees. As we begin to balance our internal resources with freight demand, we intend to reduce our use of purchased transportation, as it is more efficient and profitable to utilize our own personnel and equipment.
24
Our effective tax rate for 2010 was 39.2% as compared to 39.0% in 2009. Our effective tax rates in 2010 and 2009 were favorably impacted by alternative fuel tax credits for the use of propane in our operations. These fuel tax credits were originally scheduled to expire on December 31, 2009; however, they were extended to December 31, 2011 with the passage of the Tax Relief, Unemployment Insurance Reauthorization, and Job Creation Act of 2010 in December 2010. Our effective tax rate exceeded the federal statutory rate of 35% primarily due to the impact of state taxes and certain non-deductible items.
Liquidity and Capital Resources
A summary of our cash flows is presented below:
| (In thousands) |
2011 | 2010 | 2009 | |||||||||
| Cash and cash equivalents at beginning of year |
$ | 5,450 | $ | 4,171 | $ | 24,104 | ||||||
| Cash flows provided by (used in): |
||||||||||||
| Operating activities |
277,380 | 141,076 | 130,716 | |||||||||
| Investing activities |
(244,778 | ) | (104,297 | ) | (203,724 | ) | ||||||
| Financing activities |
37,798 | (35,500 | ) | 53,075 | ||||||||
|
|
|
|
|
|
|
|||||||
| Increase (decrease) in cash and cash equivalents |
70,400 | 1,279 | (19,933 | ) | ||||||||
|
|
|
|
|
|
|
|||||||
| Cash and cash equivalents at end of year |
$ | 75,850 | $ | 5,450 | $ | 4,171 | ||||||
|
|
|
|
|
|
|
|||||||
The changes in our cash flows provided by operating activities for the periods presented above are due primarily to the significant improvement in our results of operations, which are described above in Item 7, “Management’s Discussion and Analysis of Financial Condition and Results of Operations – Results of Operations.” Changes in cash flows used in investing activities are primarily due to a significant increase in our capital expenditures for 2011 following a reduction of capital outlays during the uncertain economic environment in 2010. These changes in our capital expenditure program are more fully described in Item 7, “Management’s Discussion and Analysis of Financial Condition and Results of Operations – Capital Expenditures.” Changes in cash flows provided by or used in financing activities consist of fluctuations in our senior unsecured revolving line of credit, scheduled principal payments, and debt and equity issuances during 2011. In January 2011, we completed a $95.0 million private placement of senior notes and in March 2011 we received net proceeds of $48.4 million resulting from the issuance of our common stock, as discussed in more detail below. A portion of the proceeds from these transactions was used to satisfy the outstanding balance on our senior unsecured revolving line of credit. Please refer to the Statements of Cash Flows included in Item 8, “Financial Statements and Supplementary Data” of this report for additional information regarding the changes in our cash and cash equivalents.
We have three primary sources of available liquidity: cash and cash equivalents, cash flows from operations and available borrowings under our senior unsecured revolving credit agreement, which is described below. We believe we also have sufficient access to debt and equity markets to provide another source of liquidity, if needed.
On January 3, 2011, we entered into a Note Purchase Agreement pursuant to which we issued $95.0 million of privately-placed senior notes. We entered into this Note Purchase Agreement to fund planned capital expenditures and for general corporate purposes. We used a portion of the proceeds to refinance existing indebtedness, including paying down the outstanding balance on our senior unsecured revolving credit agreement.
To facilitate our access to the equity market, we filed an automatic shelf registration statement with the Securities and Exchange Commission (the “SEC”) during the fourth quarter of 2009 that provides us with the opportunity to offer and sell shares of common stock on a delayed or continuous basis at indeterminate prices from time to time. Pursuant to this automatic shelf registration, we filed a prospectus supplement and entered into an At-The-Market Equity Offering Sales Agreement on February 2, 2011 with Stifel, Nicolaus & Company, Incorporated (“Stifel Nicolaus Weisel”) pursuant to which we had the ability to issue and sell, from time to time over a 12-month period through or to Stifel Nicolaus Weisel,
25
shares of our common stock having an aggregate offering price of up to $100.0 million (the “ATM program”). From February 2, 2011 through December 31, 2011, we issued 1,516,379 shares of common stock at an average price of $32.69 per share pursuant to the ATM program for aggregate gross proceeds of $49.6 million and aggregate net proceeds of $48.4 million, after deducting commissions and other transaction costs of $1.2 million. There were no subsequent issuances pursuant to the ATM program through February 2, 2012, which was the date on which the ATM program expired.
Capital Expenditures
The table below sets forth our net capital expenditures for property and equipment, including those obtained through capital leases, for the years ended December 31, 2011, 2010 and 2009:
| Year Ended December 31, | ||||||||||||
| (In thousands) |
2011 | 2010 | 2009 | |||||||||
| Land and structures |
$ | 73,463 | $ | 49,867 | $ | 120,569 | ||||||
| Tractors |
69,837 | 35,777 | 33,072 | |||||||||
| Trailers |
62,326 | 5,020 | 32,639 | |||||||||
| Technology |
24,767 | 11,866 | 7,413 | |||||||||
| Other |
28,391 | 5,000 | 17,663 | |||||||||
| Less: Proceeds from sale |
(5,436 | ) | (2,050 | ) | (2,303 | ) | ||||||
|
|
|
|
|
|
|
|||||||
| Total |
$ | 253,348 | $ | 105,480 | $ | 209,053 | ||||||
|
|
|
|
|
|
|
|||||||
Our capital expenditure requirements are generally based upon the projected increase in the number and size of service center facilities to support our plan for long-term growth, our planned tractor and trailer replacement cycle and forecasted revenue growth. Our capital expenditures for tractors and trailers increased in 2011, as we needed equipment for anticipated growth as well as to replace equipment being retired through our normal replacement cycle. In comparison, we made use of available equipment capacity in 2010 and 2009 and were able to limit our purchases of these assets. The increase in our expenditures for other assets increased in 2011 due to increased purchases of forklifts, yard tractors and alternative energy-producing assets.
We currently estimate that capital expenditures, net of anticipated proceeds from dispositions, will be approximately $300 million to $350 million for the year ending December 31, 2012. Of our capital expenditures, approximately $90 million to $120 million is allocated for the purchase of service center facilities, construction of new service center facilities or expansion of existing service center facilities; approximately $195 million to $210 million is allocated for the purchase of tractors, trailers and other equipment; and approximately $15 million to $20 million is allocated for investments in technology. We expect to fund these capital expenditures through cash flows from operations, our existing cash and cash equivalents and the use of our senior unsecured revolving credit facility. We believe our current sources of liquidity will be sufficient to satisfy our expected capital expenditures.
We anticipate that there will be additional environmental regulations and legislation resulting from the increased regulatory focus on climate change and greenhouse gas emissions in the United States. At this time, we cannot predict the requirements of any future regulations. However, any limitations on the emission of greenhouse gases or other environmental legislation could increase our future capital expenditures and have an adverse impact on our financial condition, results of operations and liquidity.
Financing Agreements
We entered into a five-year, $200.0 million senior unsecured revolving credit facility pursuant to the terms of a second amended and restated credit agreement on August 10, 2011 (the “Credit Agreement”), with Wells Fargo Bank, National Association (“Wells Fargo”) serving as administrative agent for the lenders. This Credit Agreement amended and restated the terms of the previous $225.0 million amended and restated senior unsecured revolving credit facility dated August 10, 2006. Of the $200.0 million line of credit commitments, $150.0 million may be used for letters of credit and $20.0 million may be used for borrowings under the Wells Fargo Sweep Plus Loan Program. We utilize the sweep program to manage our daily cash needs, as the sweep program automatically initiates borrowings to cover overnight cash requirements up to an aggregate of $20.0 million. In addition, we have the right to request an increase in the line of credit commitments up to a total of $300.0 million in minimum increments of $25.0 million.
26
At our option, revolving loans under the facility bear interest at either: (a) the Applicable Margin Percentage for Base Rate Loans plus the higher of Wells Fargo’s prime rate, the federal funds rate plus 0.5% per annum, or the one month LIBOR Rate plus 1.0% per annum; (b) the LIBOR Rate plus the Applicable Margin Percentage for LIBOR Loans; or (c) the LIBOR Market Index Rate (“LIBOR Index Rate”) plus the Applicable Margin Percentage for LIBOR Market Index Loans. The Applicable Margin Percentage is determined by a pricing grid in the Credit Agreement and ranges from 1.0% to 1.875%. The Applicable Margin Percentage was 1.125% for the period this Credit Agreement was in effect during 2011. Revolving loans under the sweep program bear interest at the LIBOR Index Rate.
The Credit Agreement contains customary covenants, including financial covenants that require us to observe a maximum ratio of debt to total capital and a minimum fixed charge coverage ratio. Any future wholly-owned subsidiaries of Old Dominion would be required to guarantee payment of all of our obligations under the facility. The amounts outstanding and remaining borrowing capacity under our revolving credit facilities are presented below:
| December 31, | ||||||||
| (In thousands) |
2011 | 2010 | ||||||
| Facility limit |
$ | 200,000 | $ | 225,000 | ||||
| Line of credit borrowings |
0 | (66,230 | ) | |||||
| Outstanding letters of credit |
(49,878 | ) | (49,605 | ) | ||||
|
|
|
|
|
|||||
| Total borrowing capacity |
$ | 150,122 | $ | 109,165 | ||||
|
|
|
|
|
|||||
Commitment fees ranging from 0.175% to 0.30% are charged quarterly in arrears on the aggregate unutilized portion of the Credit Agreement. Letter of credit fees equal to the applicable margin for Adjusted LIBOR Rate loans are charged quarterly in arrears on the daily average aggregate stated amount of all letters of credit outstanding during the quarter. The commitment fees and letter of credit fees were 0.20% and 1.125%, respectively, for the period the Credit Agreement was in effect during 2011. In addition, a facing fee at an annual rate of 0.125% is charged quarterly in arrears on the daily average aggregate stated amount of all letters of credit outstanding during such quarter.
We have three outstanding unsecured senior note agreements with an aggregate amount outstanding of $262.9 million at December 31, 2011. These notes call for periodic principal payments with maturities that range from 2015 to 2021, of which $35.7 million is due in the next twelve months. Interest rates on these notes are fixed and range from 4.00% to 5.85%. The effective average interest rate on our outstanding senior note agreements was 5.17% and 5.54% at December 31, 2011 and 2010, respectively.
With the exception of borrowings pursuant to the Credit Agreement, interest rates are fixed on all of our debt instruments. Therefore, short-term exposure to fluctuations in interest rates is limited to our line of credit facility. We do not currently use interest rate derivative instruments to manage exposure to interest rate changes.
Our Credit Agreement limits the amount of dividends that could be paid to shareholders to the greater of (i) $20.0 million, (ii) the amount of dividends paid in the immediately preceding fiscal year, or (iii) an amount equal to 25% of net income from the immediately preceding fiscal year. We did not declare or pay a dividend on our common stock in 2011 or 2010, and we have no plans to declare or pay a dividend in 2012.
A significant decrease in demand for our services could limit our ability to generate cash flow and affect profitability. Most of our debt agreements have covenants that require stated levels of financial performance, which if not achieved could cause acceleration of the payment schedules. As of December 31, 2011, we were in compliance with these covenants. We do not anticipate a significant decline in business levels or financial performance that would cause us to violate any such covenants in the future, and we believe the combination of our existing Credit Agreement along with our additional borrowing capacity will be sufficient to meet foreseeable seasonal and long-term capital needs.
27
Common Stock Split
On July 30, 2010, our Board of Directors approved a three-for-two common stock split for shareholders of record as of the close of business on August 9, 2010. On August 23, 2010, those shareholders received one additional share of common stock for every two shares owned. In lieu of fractional shares, shareholders received a cash payment based on the average of the high and low sales prices of the common stock on the record date.
All references in this report to shares outstanding, weighted average shares outstanding and earnings per share amounts have been restated retroactively to reflect this stock split.
Contractual Obligations
The following table summarizes our significant contractual obligations as of December 31, 2011:
| Payments due by period | ||||||||||||||||||||
| Contractual Obligations (1) |
Total | Less than 1 year |
1-3 years | 3-5 years | More than 5 years |
|||||||||||||||
| (In thousands) |
||||||||||||||||||||
| Long-term debt obligations, exclusive of interest |
$ | 262,857 | $ | 35,715 | $ | 71,428 | $ | 60,714 | $ | 95,000 | ||||||||||
| Capital lease obligations, exclusive of interest |
6,328 | 3,639 | 2,689 | 0 | 0 | |||||||||||||||
| Operating lease obligations |
73,312 | 16,256 | 22,121 | 11,319 | 23,616 | |||||||||||||||
| Purchase obligations |
55,138 | 55,138 | 0 | 0 | 0 | |||||||||||||||
|
|
|
|
|
|
|
|
|
|
|
|||||||||||
| Total |
$ | 397,635 | $ | 110,748 | $ | 96,238 | $ | 72,033 | $ | 118,616 | ||||||||||
|
|
|
|
|
|
|
|
|
|
|
|||||||||||
| (1) | Contractual obligations include long-term debt consisting of senior notes totaling $262.9 million; capital lease obligations for computer equipment; operating leases consisting primarily of real estate leases; and purchase obligations relating to non-cancellable purchase orders for equipment scheduled for delivery in 2012. Please refer to the information regarding interest rates and the balance on our revolving credit facility in this section above and also in Note 2 to the Financial Statements included in Item 8 of this report. |
Critical Accounting Policies
In preparing our financial statements, we apply the following critical accounting policies that we believe affect our judgments and estimates of amounts recorded in certain assets, liabilities, revenue and expenses. These critical accounting policies are further described in Note 1 of the Notes to the Financial Statements included in Item 8 of this report.
Revenue Recognition
We recognize revenue based upon when our transportation services have been completed in accordance with the bill of lading contract, our general tariff provisions or contractual agreements with our customers. Generally, this occurs when we complete the delivery of a shipment. For transportation services not completed at the end of a reporting period, we use a percentage of completion method to allocate the appropriate revenue to each separate reporting period. Under this method, we develop a factor for each uncompleted shipment by dividing the actual number of days in transit at the end of a reporting period by that shipment’s standard delivery time schedule. This factor is applied to the total revenue for that shipment and revenue is allocated between reporting periods accordingly.
Allowances for Uncollectible Accounts and Revenue Adjustments
We maintain an allowance for uncollectible accounts for estimated losses resulting from the inability of our customers to make required payments. We estimate this allowance by analyzing the aging of our customer receivables, our historical loss experience and other trends and factors affecting the credit risk
28
of our customers. We determine customer receivables to be past due when payment has not been received by the invoice due date. Write-offs occur when we determine an account to be uncollectible and could differ from our allowance estimate as a result of factors such as changes in the overall economic environment or risks surrounding our customers. Additional allowances may be required if the financial condition of our customers were to deteriorate, resulting in an impairment of their ability to make payments. We periodically review the underlying assumptions in our estimate of the allowance for uncollectible accounts to ensure that the allowance reflects the most recent trends and factors.
We also maintain an allowance for estimated revenue adjustments resulting from future billing corrections, customer allowances, money-back service guarantees and other miscellaneous revenue adjustments. These revenue adjustments are recorded in our revenue from operations. We use historical experience, trends and current information to update and evaluate these estimates.
Management believes the methodologies for estimating these allowances to be reliable based on the accuracy of our estimates in prior periods. As such, we do not anticipate any near-term changes in our methodologies for these estimates.
Claims and Insurance Accruals
Claims and insurance accruals reflect the estimated cost of claims for cargo loss and damage, BIPD, workers’ compensation, long-term disability, group health and dental not covered by insurance. The related costs are charged to insurance and claims expense except for workers’ compensation, long-term disability, group health and dental, which are charged to employee benefits expense.
Insurers providing excess coverage above retention levels adjust their premiums to cover insured losses and for other market factors. As a result, we periodically evaluate our self-insured retention levels to determine the most cost-efficient balance between self-insurance and excess coverage.
In establishing accruals for claims and insurance expenses, we evaluate and monitor each claim individually, and we use factors such as historical claims development experience, known trends and third-party estimates to determine the appropriate reserves for potential liability. We believe the assumptions and methods used to estimate these liabilities are reasonable; however, any changes in the severity of previously-reported claims, significant changes in the medical costs and regulatory changes affecting the administration of our plans could significantly impact the determination of appropriate reserves in future periods.
Property and Equipment
Property and equipment are recorded at cost and depreciated on a straight-line basis over their estimated economic lives. Management uses historical experience, certain assumptions and estimates in determining the economic life of each asset. Periodically, we review property and equipment for impairment due to changes in operational and market conditions, and we adjust the carrying value and economic life of any impaired asset as appropriate.
Effective January 1, 2010, estimated economic lives for structures are 7 to 30 years; revenue equipment is 4 to 15 years; other equipment is 2 to 20 years; and leasehold improvements are the lesser of the economic life of the leasehold improvement or the remaining life of the lease. The use of different assumptions, estimates or significant changes in the resale market for our equipment could result in material changes in the carrying value and related depreciation of our assets.
During the first quarter of 2010, we completed an evaluation of the estimated useful lives and salvage values for our equipment and determined that the actual period of service of certain revenue equipment exceeded that of our previously estimated useful lives. As a result, we extended the estimated useful lives of most of our tractors to 9 years from 7 years and extended the estimated useful lives of our trailers to 15 years from 12 years. In addition, we reduced the estimated salvage values associated with this equipment to more accurately reflect the value we believe such equipment will have at the end of its respective useful life. We made similar changes to the estimated useful lives and salvage values for certain of our other equipment but the results of these changes had less of an impact on our future depreciation expense. As a result of the impact on depreciation from these changes that were effective January 1, 2010, income from continuing operations and net income in 2010 increased by approximately $12.7 million and $7.7 million, respectively.
29
Inflation
Most of our expenses are affected by inflation, which typically results in increased operating costs. In response to fluctuations in the cost of petroleum products, particularly diesel fuel, we generally include a fuel surcharge in our tariffs and contractual agreements. The fuel surcharge is designed to offset the cost of diesel fuel above a base price and increases as diesel fuel prices escalate over the base, which is generally indexed to the DOE’s published fuel prices that reset each week. Volatility in the price of diesel fuel, independent of inflation, has impacted our business, as described in this report. However, we do not believe inflation has had a material effect on our results of operations for each of the past three years.
Related Person Transactions
Family Relationships
Each of Earl E. Congdon, John R. Congdon, David S. Congdon and John R. Congdon, Jr. are related to one another and served in various executive management positions and/or on our Board of Directors during 2011. We have entered into amended and restated employment agreements with Earl E. Congdon, John R. Congdon and David S. Congdon, which are incorporated by reference as exhibits to our Annual Report on Form 10-K. We regularly disclose the amount of compensation that we pay to these individuals in the proxy statement for our Annual Meeting of Shareholders.
Transactions with Old Dominion Truck Leasing, Inc.
Old Dominion Truck Leasing, Inc. (“Leasing”) is a North Carolina corporation whose voting stock is owned by an Earl E. Congdon Revocable Trust; the John R. Congdon Revocable Trust; and members of Earl E. Congdon’s and John R. Congdon’s families. Leasing is primarily engaged in the business of purchasing and leasing tractors, trailers and other vehicles. John R. Congdon is Chairman of the Board of Leasing, and Earl E. Congdon is Vice Chairman of the Board of Leasing. Since 1986, we have combined our requirements with Leasing for the purchase of tractors, trailers, equipment, parts, tires and fuel. We believe that the termination of this arrangement would not have a material adverse impact on our financial results.
We purchased $278,000, $242,000 and $231,000 of maintenance and other services from Leasing in 2011, 2010 and 2009, respectively. We believe that the prices we pay for such services are no more than what would be charged by unaffiliated third parties for the same quality of work, and we intend to continue to purchase maintenance and other services from Leasing, provided that Leasing’s prices continue to be favorable to us.
We also paid Leasing $86,000 and $114,000 for leased equipment in 2010 and 2009, respectively. These payments were for long-term leases for tractors used in our linehaul operations. We received no commission or other financial benefit from Leasing or any other party in connection with these lease transactions. We did not lease any equipment from Leasing in 2011.
We charged Leasing $18,000, $17,000 and $12,000 for the rental of property in 2011, 2010 and 2009, respectively. No other services were provided to Leasing for the years ended December 31, 2011, 2010 and 2009.
Split Dollar Life Insurance Policies
We are the owner of two split-dollar life insurance contracts insuring the life of John R. Congdon. The net cash surrender value for these policies was $6.6 million and $6.3 million at December 31, 2011 and 2010, respectively, and is included on our Balance Sheets under the caption “Other assets.” At December 31, 2011, these policies provided for an aggregate of $8.7 million in net death benefits due to the Company, of which we have endorsed $2.0 million to Mr. Congdon’s children.
30
Audit Committee Approval
The Audit Committee of our Board of Directors reviewed and approved all of the related person transactions described above in accordance with our Related Person Transactions Policy.
ITEM 7A. QUANTITATIVE AND QUALITATIVE DISCLOSURES ABOUT MARKET RISK
Market risk represents the risk of loss that may impact our financial position, results of operations and cash flows due to adverse changes in financial market prices and rates.
We are exposed to interest rate risk directly related to loans, if any, under our Credit Agreement, which have variable interest rates. A 100 basis point increase in the average interest rate on this agreement would have no material effect on our operating results. We have established policies and procedures to manage exposure to market risks and use major institutions that we believe are creditworthy to minimize credit risk.
We are exposed to market risk for equity investments relating to Company-owned life insurance contracts on certain employees. At December 31, 2011, the cash value for variable life insurance contracts was $17.2 million of the $27.6 million of aggregate cash values for all life insurance contracts included on our Balance Sheets. Variable life insurance contracts expose us to fluctuations in equity markets; however, we utilize a third-party to manage these assets and minimize that exposure. A 10% change in market value in those investments would have a $1.7 million impact on our operating income.
We are exposed to market risk for awards granted under the Old Dominion Freight Line, Inc. Phantom Stock Plan and the Old Dominion Freight Line, Inc. Director Phantom Stock Plan. The liability for the unsettled outstanding awards is remeasured at the end of each reporting period based on the closing price of our common stock at that date. At December 31, 2011, the total liability for awards granted under the Old Dominion Freight Line, Inc. Phantom Stock Plan and the Old Dominion Freight Line, Inc. Director Phantom Stock Plan totaled $10.9 million. A 10% change in the price of our common stock at December 31, 2011 would have had a $1.1 million impact on our operating income in 2011 with respect to these plans.
We are also exposed to commodity price risk related to diesel fuel prices and manage our exposure to that risk primarily through the application of fuel surcharges.
For further discussion related to these risks, see Note 2 to the Financial Statements included in Item 8, “Financial Statements and Supplementary Data” and Item 7, “Management’s Discussion and Analysis of Financial Condition and Results of Operations.”
31
ITEM 8. FINANCIAL STATEMENTS AND SUPPLEMENTARY DATA
OLD DOMINION FREIGHT LINE, INC.
BALANCE SHEETS
| December 31, | ||||||||
| (In thousands, except share data) |
2011 | 2010 | ||||||
| ASSETS |
||||||||
| Current assets: |
||||||||
| Cash and cash equivalents |
$ | 75,850 | $ | 5,450 | ||||
| Customer receivables, less allowances of $9,173 and $8,475, respectively |
213,481 | 172,989 | ||||||
| Other receivables |
4,441 | 7,711 | ||||||
| Prepaid expenses and other current assets |
18,614 | 17,766 | ||||||
| Deferred income taxes |
19,466 | 18,666 | ||||||
|
|
|
|
|
|||||
| Total current assets |
331,852 | 222,582 | ||||||
| Property and equipment: |
||||||||
| Revenue equipment |
789,984 | 701,648 | ||||||
| Land and structures |
738,359 | 667,917 | ||||||
| Other fixed assets |
214,816 | 170,533 | ||||||
| Leasehold improvements |
5,773 | 4,421 | ||||||
|
|
|
|
|
|||||
| Total property and equipment |
1,748,932 | 1,544,519 | ||||||
| Less: Accumulated depreciation |
(621,982 | ) | (580,303 | ) | ||||
|
|
|
|
|
|||||
| Net property and equipment |
1,126,950 | 964,216 | ||||||
| Goodwill |
19,463 | 19,463 | ||||||
| Other assets |
34,809 | 33,620 | ||||||
|
|
|
|
|
|||||
| Total assets |
$ | 1,513,074 | $ | 1,239,881 | ||||
|
|
|
|
|
|||||
| LIABILITIES AND SHAREHOLDERS’ EQUITY |
||||||||
| Current liabilities: |
||||||||
| Accounts payable |
$ | 42,096 | $ | 29,221 | ||||
| Compensation and benefits |
66,740 | 51,355 | ||||||
| Claims and insurance accruals |
35,934 | 33,927 | ||||||
| Other accrued liabilities |
20,686 | 18,413 | ||||||
| Current maturities of long-term debt |
39,354 | 37,130 | ||||||
|
|
|
|
|
|||||
| Total current liabilities |
204,810 | 170,046 | ||||||
| Long-term debt |
229,831 | 234,087 | ||||||
| Other non-current liabilities |
86,998 | 76,331 | ||||||
| Deferred income taxes |
134,916 | 90,768 | ||||||
|
|
|
|
|
|||||
| Total long-term liabilities |
451,745 | 401,186 | ||||||
| Commitments and contingent liabilities |
0 | 0 | ||||||
|
|
|
|
|
|||||
| Total liabilities |
656,555 | 571,232 | ||||||
| Shareholders’ equity |
||||||||
| Common stock - $0.10 par value, 70,000,000 shares authorized, 57,443,324 and 55,926,945 shares outstanding at December 31, 2011 and 2010, respectively |
5,744 | 5,593 | ||||||
| Capital in excess of par value |
137,275 | 89,026 | ||||||
| Retained earnings |
713,500 | 574,030 | ||||||
|
|
|
|
|
|||||
| Total shareholders’ equity |
856,519 | 668,649 | ||||||
|
|
|
|
|
|||||
| Total liabilities and shareholders’ equity |
$ | 1,513,074 | $ | 1,239,881 | ||||
|
|
|
|
|
|||||
The accompanying notes are an integral part of these financial statements.
32
OLD DOMINION FREIGHT LINE, INC.
STATEMENTS OF OPERATIONS
| Year Ended December 31, | ||||||||||||
| (In thousands, except share and per share data) |
2011 | 2010 | 2009 | |||||||||
| Revenue from operations |
$ | 1,882,541 | $ | 1,480,998 | $ | 1,245,005 | ||||||
| Operating expenses: |
||||||||||||
| Salaries, wages and benefits |
956,079 | 808,819 | 718,744 | |||||||||
| Operating supplies and expenses |
355,186 | 244,291 | 181,329 | |||||||||
| General supplies and expenses |
49,900 | 41,580 | 35,013 | |||||||||
| Operating taxes and licenses |
63,284 | 55,420 | 50,175 | |||||||||
| Insurance and claims |
27,693 | 25,329 | 23,095 | |||||||||
| Communications and utilities |
18,104 | 15,218 | 14,614 | |||||||||
| Depreciation and amortization |
90,820 | 80,362 | 94,784 | |||||||||
| Purchased transportation |
63,257 | 50,489 | 33,786 | |||||||||
| Building and office equipment rents |
13,689 | 15,244 | 14,900 | |||||||||
| Miscellaneous expenses, net |
10,457 | 6,507 | 8,174 | |||||||||
|
|
|
|
|
|
|
|||||||
| Total operating expenses |
1,648,469 | 1,343,259 | 1,174,614 | |||||||||
|
|
|
|
|
|
|
|||||||
| Operating income |
234,072 | 137,739 | 70,391 | |||||||||
| Non-operating expense (income): |
||||||||||||
| Interest expense |
14,067 | 12,613 | 13,041 | |||||||||
| Interest income |
(180 | ) | (148 | ) | (43 | ) | ||||||
| Other expense, net |
101 | 848 | 228 | |||||||||
|
|
|
|
|
|
|
|||||||
| Total non-operating expense |
13,988 | 13,313 | 13,226 | |||||||||
|
|
|
|
|
|
|
|||||||
| Income before income taxes |
220,084 | 124,426 | 57,165 | |||||||||
| Provision for income taxes |
80,614 | 48,775 | 22,294 | |||||||||
|
|
|
|
|
|
|
|||||||
| Net income |
$ | 139,470 | $ | 75,651 | $ | 34,871 | ||||||
|
|
|
|
|
|
|
|||||||
| Earnings per share: |
||||||||||||
| Basic |
$ | 2.44 | $ | 1.35 | $ | 0.62 | ||||||
| Diluted |
$ | 2.44 | $ | 1.35 | $ | 0.62 | ||||||
| Weighted average shares outstanding: |
||||||||||||
| Basic |
57,146,486 | 55,926,988 | 55,927,013 | |||||||||
| Diluted |
57,146,486 | 55,926,988 | 55,927,013 | |||||||||
The accompanying notes are an integral part of these financial statements.
33
OLD DOMINION FREIGHT LINE, INC.
STATEMENTS OF CHANGES IN SHAREHOLDERS’ EQUITY
| Capital in Excess of |
Retained | |||||||||||||||||||
| Common Stock | ||||||||||||||||||||
| (In thousands) |
Shares | Amount | Par Value | Earnings | Total | |||||||||||||||
| Balance as of December 31, 2008 |
55,927 | $ | 5,593 | $ | 89,028 | $ | 463,508 | $ | 558,129 | |||||||||||
| Net income |
0 | 0 | 0 | 34,871 | 34,871 | |||||||||||||||
|
|
|
|
|
|
|
|
|
|
|
|||||||||||
| Balance as of December 31, 2009 |
55,927 | $ | 5,593 | $ | 89,028 | $ | 498,379 | $ | 593,000 | |||||||||||
| Net income |
0 | 0 | 0 | 75,651 | 75,651 | |||||||||||||||
| Purchase of fractional shares |
0 | 0 | (2 | ) | 0 | (2 | ) | |||||||||||||
|
|
|
|
|
|
|
|
|
|
|
|||||||||||
| Balance as of December 31, 2010 |
55,927 | $ | 5,593 | $ | 89,026 | $ | 574,030 | $ | 668,649 | |||||||||||
| Issuance and sale of common stock |
1,516 | 151 | 48,249 | 0 | 48,400 | |||||||||||||||
| Net income |
0 | 0 | 0 | 139,470 | 139,470 | |||||||||||||||
|
|
|
|
|
|
|
|
|
|
|
|||||||||||
| Balance as of December 31, 2011 |
57,443 | $ | 5,744 | $ | 137,275 | $ | 713,500 | $ | 856,519 | |||||||||||
|
|
|
|
|
|
|
|
|
|
|
|||||||||||
The accompanying notes are an integral part of these financial statements.
34
OLD DOMINION FREIGHT LINE, INC.
STATEMENTS OF CASH FLOWS
| Year Ended December 31, | ||||||||||||
| (In thousands) |
2011 | 2010 | 2009 | |||||||||
| Cash flows from operating activities: |
||||||||||||
| Net income |
$ | 139,470 | $ | 75,651 | $ | 34,871 | ||||||
| Adjustments to reconcile net income to net cash provided by operating activities: |
||||||||||||
| Depreciation and amortization |
90,820 | 80,362 | 94,784 | |||||||||
| Loss on sale of property and equipment |
1,263 | 758 | 173 | |||||||||
| Deferred income taxes |
43,348 | 7,624 | 10,778 | |||||||||
| Changes in assets and liabilities, net of acquisition effects: |
||||||||||||
| Customer and other receivables, net |
(40,414 | ) | (36,169 | ) | 2,806 | |||||||
| Prepaid expenses and other assets |
(3,506 | ) | (12,760 | ) | (4,713 | ) | ||||||
| Accounts payable |
12,875 | (4,247 | ) | (7,531 | ) | |||||||
| Compensation, benefits and other accrued liabilities |
17,626 | 22,476 | (10,746 | ) | ||||||||
| Claims and insurance accruals |
6,696 | 3,831 | 3,274 | |||||||||
| Income taxes, net |
3,224 | (3,613 | ) | 2,812 | ||||||||
| Other liabilities |
5,978 | 7,163 | 4,208 | |||||||||
|
|
|
|
|
|
|
|||||||
| Net cash provided by operating activities |
277,380 | 141,076 | 130,716 | |||||||||
|
|
|
|
|
|
|
|||||||
| Cash flows from investing activities: |
||||||||||||
| Purchase of property and equipment |
(250,214 | ) | (106,347 | ) | (210,888 | ) | ||||||
| Proceeds from sale of property and equipment |
5,436 | 2,050 | 2,303 | |||||||||
| Proceeds from sale of short-term investment securities |
0 | 0 | 4,861 | |||||||||
|
|
|
|
|
|
|
|||||||
| Net cash used in investing activities |
(244,778 | ) | (104,297 | ) | (203,724 | ) | ||||||
|
|
|
|
|
|
|
|||||||
| Cash flows from financing activities: |
||||||||||||
| Proceeds from issuance of long-term debt |
96,010 | 0 | 0 | |||||||||
| Principal payments under long-term debt agreements |
(40,382 | ) | (36,681 | ) | (11,972 | ) | ||||||
| Net (payments) proceeds on revolving line of credit |
(66,230 | ) | 1,183 | 65,047 | ||||||||
| Proceeds from stock issuance, net of issuance costs |
48,400 | 0 | 0 | |||||||||
| Other financing activities, net |
0 | (2 | ) | 0 | ||||||||
|
|
|
|
|
|
|
|||||||
| Net cash provided by (used in) financing activities |
37,798 | (35,500 | ) | 53,075 | ||||||||
|
|
|
|
|
|
|
|||||||
| Increase (decrease) in cash and cash equivalents |
70,400 | 1,279 | (19,933 | ) | ||||||||
| Cash and cash equivalents at beginning of year |
5,450 | 4,171 | 24,104 | |||||||||
|
|
|
|
|
|
|
|||||||
| Cash and cash equivalents at end of year |
$ | 75,850 | $ | 5,450 | $ | 4,171 | ||||||
|
|
|
|
|
|
|
|||||||
| Income taxes paid |
$ | 34,579 | $ | 44,893 | $ | 9,027 | ||||||
| Interest paid |
$ | 14,011 | $ | 13,561 | $ | 14,708 | ||||||
| Capitalized interest |
$ | 895 | $ | 682 | $ | 1,654 | ||||||
| Supplemental disclosure of noncash investing and financing activities: |
||||||||||||
| Acquisition of property and equipment by capital lease |
$ | 8,570 | $ | 1,183 | $ | 468 | ||||||
| Fair value of property exchanged |
$ | 0 | $ | 544 | $ | 1,277 | ||||||
The accompanying notes are an integral part of these financial statements.
35
OLD DOMINION FREIGHT LINE, INC.
NOTES TO THE FINANCIAL STATEMENTS
Note 1. Significant Accounting Policies
Business
Old Dominion is a leading, less-than-truckload (“LTL”), union-free motor carrier providing regional, inter-regional and national LTL service and value-added logistics services from a single integrated organization. In addition to our core LTL services, we offer our customers a broad range of logistics services including ground and air expedited transportation, supply chain consulting, transportation management, truckload brokerage, container delivery and warehousing services. Through marketing and carrier relationships, we also offer door-to-door international freight services to and from all of North America, Central America, South America and the Far East.
We have one operating segment and no single customer that exceeds 10% of our revenue.
Basis of Presentation
The preparation of financial statements in conformity with U.S. generally accepted accounting principles requires management to make estimates and assumptions that affect the amounts reported in the financial statements and accompanying notes. Actual results could differ from those estimates.
Certain amounts in prior years have been reclassified to conform prior years’ financial statements to the current presentation.
Unless the context requires otherwise, references in these Notes to “Old Dominion,” the “Company,” “we,” “us” and “our” refer to Old Dominion Freight Line, Inc.
Revenue and Expense Recognition
We recognize revenue based upon when our transportation services have been completed in accordance with the bill of lading contract, our general tariff provisions or contractual agreements with our customers. Generally, this occurs when we complete the delivery of a shipment. For transportation services not completed at the end of a reporting period, we use a percentage of completion method to allocate the appropriate revenue to each separate reporting period. Under this method, we develop a factor for each uncompleted shipment by dividing the actual number of days in transit at the end of a reporting period by that shipment’s standard delivery time schedule. This factor is applied to the total revenue for that shipment and revenue is allocated between reporting periods accordingly.
Expenses are recognized when incurred.
Allowances for Uncollectible Accounts and Revenue Adjustments
We maintain an allowance for uncollectible accounts for estimated losses resulting from the inability of our customers to make required payments. We estimate this allowance by analyzing the aging of our customer receivables, our historical loss experience and other trends and factors affecting the credit risk of our customers. Write-offs occur when we determine an account to be uncollectible and could differ from our allowance estimate as a result of factors such as changes in the overall economic environment or risks surrounding our customers. Additional allowances may be required if the financial condition of our customers were to deteriorate, resulting in an impairment of their ability to make payments. We periodically review the underlying assumptions in our estimate of the allowance for uncollectible accounts to ensure that the allowance reflects the most recent trends and factors.
We also maintain an allowance for estimated revenue adjustments resulting from future billing corrections, customer allowances, money-back service guarantees and other miscellaneous revenue adjustments. These revenue adjustments are recorded in our revenue from operations. We use historical experience, trends and current information to update and evaluate these estimates.
36
OLD DOMINION FREIGHT LINE, INC.
NOTES TO THE FINANCIAL STATEMENTS (CONTINUED)
Credit Risk
Financial instruments that potentially subject us to concentrations of credit risk consist principally of customer receivables. We perform initial and ongoing credit evaluations of our customers to minimize credit risk. We generally do not require collateral but may require prepayment of our services under certain circumstances. Credit risk is generally diversified due to the large number of entities comprising our customer base and their dispersion across many different industries and geographic regions. We are also exposed to credit risk associated with Company-owned life insurance contracts on certain employees. We utilize a third-party to manage these assets and minimize our exposure to fluctuations in equity markets related to these variable life insurance contracts.
Cash and Cash Equivalents
We consider cash on hand and deposits in banks along with certificates of deposit and short-term marketable securities with original maturities of three months or less as cash and cash equivalents.
Property and Equipment
Property and equipment are stated at cost. Major additions and improvements are capitalized, while maintenance and repairs that do not improve or extend the lives of the respective assets are charged to expense as incurred. We capitalize the cost of tires mounted on purchased revenue equipment as a part of the total equipment cost. Subsequent replacement tires are expensed at the time those tires are placed in service.
Depreciation of property and equipment is calculated using the straight-line method over the estimated useful lives of the related assets. The following table provides the estimated useful lives by asset type:
| Structures | 7 to 30 years | |
| Revenue equipment | 4 to 15 years | |
| Other equipment | 2 to 20 years | |
| Leasehold improvements | Lesser of economic life or life of lease |
Depreciation expense, which includes the amortization of capital leases, was $89.9 million, $79.4 million and $93.9 million for 2011, 2010 and 2009, respectively.
During the first quarter of 2010, we completed an evaluation of the estimated useful lives and salvage values for our equipment and determined that the actual period of service of certain revenue equipment exceeded that of our previously estimated useful lives. As a result, we extended the estimated useful lives of most of our tractors to 9 years from 7 years and extended the estimated useful lives of our trailers to 15 years from 12. In addition, we reduced the estimated salvage values associated with this equipment to more accurately reflect the value we believe such equipment will have at the end of its respective useful life. We made similar changes to the estimated useful lives and salvage values for certain of our other equipment but the results of these changes have less of an impact on our future depreciation expense. As a result of the impact on depreciation from these changes that were effective January 1, 2010, income from continuing operations and net income in 2010 increased by approximately $12.7 million and $7.7 million, respectively.
Goodwill and Other Intangible Assets
Intangible assets have been acquired in connection with business combinations and are comprised of goodwill and other intangible assets. Goodwill is calculated as the excess cost over the fair value of assets acquired and is not subject to amortization. We review our goodwill balance annually for impairment, unless circumstances dictate more frequent assessments. In 2011, we adopted Accounting Standards Update (“ASU”) 2011-08, Testing Goodwill for Impairment, which allows us to first assess
37
OLD DOMINION FREIGHT LINE, INC.
NOTES TO THE FINANCIAL STATEMENTS (CONTINUED)
qualitative factors to determine whether it is necessary to perform the two-step quantitative goodwill impairment test. Under this amendment, we would not be required to calculate the fair value of a reporting unit unless we determine, based on the qualitative review, that it is more likely than not that its fair value is less than its carrying amount. The amendment includes events and circumstances for us to consider when conducting the qualitative assessment. In the fourth quarter of 2011, we performed the qualitative assessment of goodwill and determined it was more likely than not that the fair value of our reporting unit would be greater than its carrying amount. Therefore, we determined it was not necessary to perform the two-step goodwill impairment test. There has been no historical impairment of our goodwill balance since the acquisition of the goodwill.
Other intangible assets include the value of acquired customer lists and related non-compete agreements and are amortized on a straight-line basis over their estimated useful lives, none of which exceeds ten years. The gross carrying amount of our other intangible assets totaled $8.1 million as of December 31, 2011 and 2010. Accumulated amortization for these assets was $4.7 million and $3.8 million as of December 31, 2011 and 2010, respectively. The net carrying amounts of our other intangible assets are included in “Other assets” on our Balance Sheets. Amortization expense was $0.9 million for 2011, 2010 and 2009. Annual amortization expense for the next five years for these intangible assets is estimated to be:
| (In thousands) |
||||
| 2012 |
$ | 908 | ||
| 2013 |
$ | 712 | ||
| 2014 |
$ | 695 | ||
| 2015 |
$ | 495 | ||
| 2016 |
$ | 315 | ||
Long-Lived Assets
We assess the realizable value of our long-lived assets and evaluate such assets for impairment whenever events or changes in circumstances indicate the carrying amount of an asset may not be recoverable.
Claims and Insurance Accruals
We are self-insured for bodily injury and property damage (“BIPD”) claims up to $2.75 million per occurrence. Cargo loss and damage claims are self-insured up to $100,000 per occurrence. We are exposed to workers’ compensation claims up to $1.0 million per occurrence, through either self-insurance or insurance deductibles. In 2011, we self-insured our group health claims up to $375,000 per occurrence plus an aggregate $200,000 over this retention level. We self-insured long-term disability claims to a maximum of $3,000 per month for our salaried and non-salaried employees until April 2, 2010 and July 1, 2011, respectively. We subsequently began to offer elective coverage to our employees and, therefore, we have no liability for new long-term disability claims after those dates.
Claims and insurance accruals reflect the estimated cost of claims for cargo loss and damage, BIPD, workers’ compensation, long-term disability, group health and dental not covered by insurance. These accruals include amounts for future claim development and claims incurred but not reported, which are primarily based on historical claims development experience. The related costs for cargo loss and damage and BIPD are charged to insurance and claims expense, while the related costs for workers’ compensation, long-term disability, group health and dental are charged to employee benefits expense.
We reserved $86.0 million and $79.3 million at December 31, 2011 and 2010, respectively, for self-insured claims and insurance reserves. The long-term portions of those reserves were $50.1 million and $45.4 million for 2011 and 2010, respectively, which were included in “Other non-current liabilities” on our Balance Sheets.
38
OLD DOMINION FREIGHT LINE, INC.
NOTES TO THE FINANCIAL STATEMENTS (CONTINUED)
Advertising
The costs of advertising our services are expensed as incurred and are included in “General supplies and expenses” on our Statements of Operations. Advertising costs charged to expense totaled $8.3 million, $6.3 million and $4.1 million for 2011, 2010 and 2009, respectively.
Fair Values of Financial Instruments
At December 31, 2011 and 2010, the carrying values of financial instruments, such as cash and cash equivalents, customer and other receivables and trade payables, approximate their fair value due to the short maturities of these instruments. The cash surrender value relating to Company-owned life insurance contracts is included in “Other assets” on our Balance Sheets and totaled $27.6 million and $25.8 million at December 31, 2011 and 2010, respectively, which approximates fair value. The fair value of the senior notes included in our long-term debt was estimated to be $270.3 million and $212.3 million at December 31, 2011 and 2010, respectively. The fair value of these senior notes is based on undiscounted cash flows at market interest rates for similar issuances of private debt.
Earnings Per Share
Earnings per common share is computed using the weighted-average number of common shares outstanding during the period.
Common Stock Split
On July 30, 2010, our Board of Directors approved a three-for-two common stock split for shareholders of record as of the close of business on August 9, 2010. On August 23, 2010, those shareholders received one additional share of common stock for every two shares owned. In lieu of fractional shares, shareholders received a cash payment based on the average of the high and low sales prices of the common stock on the record date.
All references in this report to shares outstanding, weighted average shares outstanding and earnings per share amounts have been restated retroactively to reflect this stock split.
Recent Accounting Pronouncements
In September 2011, the Financial Accounting Standards Board issued ASU 2011-08, Testing Goodwill for Impairment, which provides amendments to the existing two-step goodwill impairment test as described in Topic 350, Intangibles—Goodwill and Other. The amendments permit a first assessment of qualitative factors to determine whether it is more likely than not that the fair value of a reporting unit is less than its carrying amount as a basis for determining whether it is necessary to perform the two-step goodwill impairment test. The qualitative assessment is optional, allowing companies to go directly to the quantitative assessment. Although amendments of ASU 2011-08 are effective for annual and interim goodwill impairment tests performed for fiscal years beginning after December 15, 2011, early adoption was permitted. We adopted the provisions of ASU 2011-08 in the fourth quarter of 2011 without a material impact on our financial position, results of operations or cash flows.
39
OLD DOMINION FREIGHT LINE, INC.
NOTES TO THE FINANCIAL STATEMENTS (CONTINUED)
Note 2. Long-term Debt
Long-term debt consisted of the following:
| December 31, | ||||||||
| (In thousands) |
2011 | 2010 | ||||||
| Senior notes |
$ | 262,857 | $ | 203,572 | ||||
| Revolving credit facility |
0 | 66,230 | ||||||
| Capitalized lease and other obligations |
6,328 | 1,415 | ||||||
|
|
|
|
|
|||||
| Total long-term debt |
269,185 | 271,217 | ||||||
| Less: Current maturities |
(39,354 | ) | (37,130 | ) | ||||
|
|
|
|
|
|||||
| Total maturities due after one year |
$ | 229,831 | $ | 234,087 | ||||
|
|
|
|
|
|||||
We have three outstanding unsecured senior note agreements with an aggregate amount outstanding of $262.9 million at December 31, 2011. These notes call for periodic principal payments with maturities that range from 2015 to 2021, of which $35.7 million is due in the next twelve months. Interest rates on these notes are fixed and range from 4.00% to 5.85%. The effective average interest rate on our outstanding senior note agreements was 5.17% and 5.54% at December 31, 2011 and 2010, respectively.
Included in our senior notes is $95.0 million related to a Note Purchase Agreement by and among the Company and the purchasers, dated as of January 3, 2011. Under this agreement, we issued $50.0 million of privately-placed Senior Notes, Tranche A (the “Tranche A Notes”) and $45.0 million of privately-placed Senior Notes, Tranche B (the “Tranche B Notes” and, together with the Tranche A Notes, the “Notes”) on January 3, 2011. The Notes are unsecured and rank equally in right of repayment with the Company’s other senior unsecured indebtedness. The Tranche A Notes mature on January 3, 2018. The Company will pay interest on the unpaid balance of the Tranche A Notes at the rate of 4.00% per annum from the date of issuance. The Tranche B Notes mature on January 3, 2021. The Company will pay interest on the unpaid balance of the Tranche B Notes at the rate of 4.79% per annum from the date of issuance. The Company used a portion of the proceeds of the issuance of the Notes to refinance existing indebtedness, including paying down the outstanding balance on its senior unsecured revolving credit facility in January 2011.
We entered into a five-year, $200.0 million senior unsecured revolving credit facility pursuant to the terms of a second amended and restated credit agreement on August 10, 2011 (the “Credit Agreement”), with Wells Fargo Bank, National Association (“Wells Fargo”) serving as administrative agent for the lenders. This Credit Agreement amended and restated the terms of the previous senior unsecured revolving credit facility dated August 10, 2006. Of the $200.0 million line of credit commitments, $150.0 million may be used for letters of credit and $20.0 million may be used for borrowings under the Wells Fargo Sweep Plus Loan Program. This sweep program is a daily cash management tool that automatically initiates borrowings to cover overnight cash requirements up to an aggregate of $20.0 million. In addition, we have the right to request an increase in the line of credit commitments up to a total of $300.0 million in minimum increments of $25.0 million. At our option, revolving loans under the facility bear interest at either: (a) the Applicable Margin Percentage for Base Rate Loans plus the higher of Wells Fargo’s prime rate, the federal funds rate plus 0.5% per annum, or the one month LIBOR Rate plus 1.0% per annum; (b) the LIBOR Rate plus the Applicable Margin Percentage for LIBOR Loans; or (c) the LIBOR Market Index Rate (“LIBOR Index Rate”) plus the Applicable Margin Percentage for LIBOR Market Index Loans. The Applicable Margin Percentage is determined by a pricing grid in the Credit Agreement and ranges from 1.0% to 1.875%. The Applicable Margin Percentage was 1.125% for the period this Credit Agreement was in effect during 2011. Revolving loans under the sweep program bear interest at the LIBOR Index Rate.
The Credit Agreement contains customary covenants, including financial covenants that require us to observe a maximum ratio of debt to total capital and a minimum fixed charge coverage ratio. Any future wholly-owned subsidiaries of the Company would be required to guarantee payment of all of our obligations under the facility. There was no outstanding balance on the line of credit facility at December 31, 2011. The outstanding balance of borrowings on the line of credit facility was $66.2 million at December 31, 2010. There were $49.9 million and $49.6 million of outstanding letters of credit at December 31, 2011 and 2010, respectively.
40
OLD DOMINION FREIGHT LINE, INC.
NOTES TO THE FINANCIAL STATEMENTS (CONTINUED)
Commitment fees ranging from 0.175% to 0.30% are charged quarterly in arrears on the aggregate unutilized portion of the Credit Agreement. Letter of credit fees equal to the applicable margin for Adjusted LIBOR Rate loans are charged quarterly in arrears on the daily average aggregate stated amount of all letters of credit outstanding during the quarter. The commitment fees and letter of credit fees were 0.20% and 1.125%, respectively, for the period this Credit Agreement was in effect during 2011. In addition, the Company will pay to Wells Fargo for its own account as issuer of letters of credit (i) a facing fee with respect to each letter of credit in an amount equal to 0.125% of the daily average aggregate Stated Amount thereof, payable quarterly in arrears and calculated on an actual/360-day basis and (ii) such fees and charges customarily charged in connection with the issuance and administration of such letters of credit. Wells Fargo, as administrative agent, shall also receive an annual administrative fee for providing such services.
Our Credit Agreement limits the amount of dividends that could be paid to shareholders to the greater of (i) $20.0 million, (ii) the amount of dividends paid in the immediately preceding fiscal year, or (iii) an amount equal to 25% of net income from the immediately preceding fiscal year. We did not declare or pay a dividend on our common stock in 2011 or 2010, and we have no plans to declare or pay a dividend in 2012.
Our three outstanding senior note agreements and the Credit Agreement contain customary covenants, including financial covenants that require us to observe a maximum ratio of debt to total capital and a minimum fixed charge coverage ratio. Any future wholly-owned subsidiaries of the Company would be required to guarantee payment of all of our obligations under these agreements.
At December 31, 2010, the outstanding balance of borrowings on our previous line of credit facility of $66.2 million was reported as a long-term liability despite that facility’s maturity within one year of the balance sheet date, as we utilized a portion of the $95.0 million of proceeds obtained from privately-placed senior notes issued on January 3, 2011 to refinance the outstanding balance on the Credit Agreement.
Capitalized lease obligations are collateralized by property and equipment with a book value of $9.2 million at December 31, 2011.
As of December 31, 2011, aggregate maturities of long-term debt are as follows:
| (In thousands) |
||||
| 2012 |
$ | 39,354 | ||
| 2013 |
38,403 | |||
| 2014 |
35,714 | |||
| 2015 |
35,714 | |||
| 2016 |
25,000 | |||
| Thereafter |
95,000 | |||
|
|
|
|||
| $ | 269,185 | |||
|
|
|
|||
Note 3. Shareholders’ Equity
On February 2, 2011, we entered into an At-The-Market Equity Offering Sales Agreement with Stifel, Nicolaus & Company, Incorporated (“Stifel Nicolaus Weisel”) pursuant to which we had the ability to issue and sell, from time to time over a 12-month period through or to Stifel Nicolaus Weisel, shares of our common stock having an aggregate offering price of up to $100.0 million (the “ATM program”). The ATM program was conducted pursuant to the Company’s automatic shelf registration statement on Form S-3 (File No. 333-162709), filed by the Company on October 28, 2009 with the SEC, and a prospectus supplement, filed by the Company on February 2, 2011 with the SEC. Sales of the Company’s common stock in the offering were made by means of ordinary brokers’ transactions on the Nasdaq, in privately negotiated transactions, or otherwise at prevailing market prices at the time of sale. Set forth below is information regarding our ATM program from February 2, 2011 through December 31, 2011.
| Period |
Aggregate Number of Shares Sold |
Aggregate Gross Proceeds |
Aggregate Net Proceeds |
Average Sales Price Per Share |
||||||||||||
| First quarter 2011 |
1,516,379 | $ | 49,575,000 | $ | 48,400,000 | $ | 32.69 | |||||||||
There were no subsequent issuances pursuant to the ATM program through February 2, 2012, which was the date on which the ATM program expired.
41
OLD DOMINION FREIGHT LINE, INC.
NOTES TO THE FINANCIAL STATEMENTS (CONTINUED)
Note 4. Leases
We lease certain information systems under capital leases. We also lease other assets under operating leases, which primarily consist of real estate leases for 77 of our 216 service center locations at December 31, 2011.
Certain operating leases provide for renewal options. Renewal options and length of renewals vary by lease and are typically offered at their fair rental value. We have not made any residual value guarantees related to our operating leases; therefore, we have no corresponding liability recorded on our Balance Sheets.
Assets under capital leases are included in property and equipment as follows:
| December 31, | ||||||||
| (In thousands) |
2011 | 2010 | ||||||
| Information systems |
$ | 12,232 | $ | 3,587 | ||||
| Less: Accumulated amortization |
(3,065 | ) | (2,360 | ) | ||||
|
|
|
|
|
|||||
| $ | 9,167 | $ | 1,227 | |||||
|
|
|
|
|
|||||
Future minimum annual lease payments as of December 31, 2011 are as follows:
| (In thousands) |
Capital Leases |
Operating Leases |
Total | |||||||||
| 2012 |
$ | 3,728 | $ | 16,256 | $ | 19,984 | ||||||
| 2013 |
2,730 | 12,682 | 15,412 | |||||||||
| 2014 |
— | 9,439 | 9,439 | |||||||||
| 2015 |
— | 6,193 | 6,193 | |||||||||
| 2016 |
— | 5,126 | 5,126 | |||||||||
| Thereafter |
— | 23,616 | 23,616 | |||||||||
|
|
|
|
|
|
|
|||||||
| Total minimum lease payments |
6,458 | $ | 73,312 | $ | 79,770 | |||||||
|
|
|
|
|
|||||||||
| Less: Amount representing interest |
(130 | ) | ||||||||||
|
|
|
|||||||||||
| Present value of capitalized lease obligations |
$ | 6,328 | ||||||||||
|
|
|
|||||||||||
Aggregate expense under operating leases was $19.5 million, $21.0 million and $20.5 million for 2011, 2010 and 2009, respectively. Certain operating leases include rent escalation provisions, which we recognize as expense on a straight-line basis.
Note 5. Income Taxes
The components of the provision for income taxes are as follows:
| Year Ended December 31, | ||||||||||||
| (In thousands) |
2011 | 2010 | 2009 | |||||||||
| Current: |
||||||||||||
| Federal |
$ | 27,470 | $ | 34,255 | $ | 7,910 | ||||||
| State |
9,796 | 6,896 | 3,605 | |||||||||
|
|
|
|
|
|
|
|||||||
| 37,266 | 41,151 | 11,515 | ||||||||||
| Deferred: |
||||||||||||
| Federal |
39,934 | 6,695 | 9,752 | |||||||||
| State |
3,414 | 929 | 1,027 | |||||||||
|
|
|
|
|
|
|
|||||||
| 43,348 | 7,624 | 10,779 | ||||||||||
|
|
|
|
|
|
|
|||||||
| Total provision for income taxes |
$ | 80,614 | $ | 48,775 | $ | 22,294 | ||||||
|
|
|
|
|
|
|
|||||||
42
OLD DOMINION FREIGHT LINE, INC.
NOTES TO THE FINANCIAL STATEMENTS (CONTINUED)
The following is a reconciliation of the U.S. statutory federal income tax rates with our effective income tax rates for 2011, 2010 and 2009:
| Year Ended December 31, | ||||||||||||
| (In thousands) |
2011 | 2010 | 2009 | |||||||||
| Tax provision at statutory rate on income before income taxes |
$ | 77,029 | $ | 43,549 | $ | 20,008 | ||||||
| State income taxes, net of federal benefit |
7,480 | 5,002 | 2,359 | |||||||||
| Meals and entertainment disallowance |
721 | 616 | 521 | |||||||||
| Tax credits |
(4,453 | ) | (744 | ) | (783 | ) | ||||||
| Other, net |
(163 | ) | 352 | 189 | ||||||||
|
|
|
|
|
|
|
|||||||
| Total provision for income taxes |
$ | 80,614 | $ | 48,775 | $ | 22,294 | ||||||
|
|
|
|
|
|
|
|||||||
Deferred tax assets and liabilities consist of the following:
| December 31, | ||||||||
| (In thousands) |
2011 | 2010 | ||||||
| Deferred tax assets: |
||||||||
| Claims and insurance reserves |
$ | 33,424 | $ | 30,823 | ||||
| Allowance for doubtful accounts |
2,827 | 2,642 | ||||||
| Accrued vacation |
9,339 | 8,332 | ||||||
| Deferred compensation |
14,441 | 12,204 | ||||||
| Other |
11,036 | 6,652 | ||||||
|
|
|
|
|
|||||
| Total deferred tax assets |
71,067 | 60,653 | ||||||
| Deferred tax liabilities: |
||||||||
| Depreciation |
(174,353 | ) | (122,950 | ) | ||||
| Unrecognized revenue |
(6,995 | ) | (6,084 | ) | ||||
| Employee benefits |
(3,421 | ) | (2,544 | ) | ||||
| Other |
(1,748 | ) | (1,177 | ) | ||||
|
|
|
|
|
|||||
| Total deferred tax liabilities |
(186,517 | ) | (132,755 | ) | ||||
|
|
|
|
|
|||||
| Net deferred tax liability |
$ | (115,450 | ) | $ | (72,102 | ) | ||
|
|
|
|
|
|||||
Our net deferred tax liability consists of the following:
| December 31, | ||||||||
| (In thousands) |
2011 | 2010 | ||||||
| Current deferred tax asset |
$ | 19,466 | $ | 18,666 | ||||
| Noncurrent deferred tax liability |
(134,916 | ) | (90,768 | ) | ||||
|
|
|
|
|
|||||
| Net deferred tax liability |
$ | (115,450 | ) | $ | (72,102 | ) | ||
|
|
|
|
|
|||||
We are subject to U.S. federal income tax, as well as income tax of multiple state tax jurisdictions. We remain open to examination by the Internal Revenue Service for tax years 2008 through 2011. We remain open to examination by state tax jurisdictions for tax years 2007 through 2011.
Changes in our liability for unrecognized tax benefits could affect our effective tax rate, if recognized, but we do not expect any material changes within the next twelve months. Interest and penalties related to uncertain income tax positions, which are immaterial, are recorded in our Provision for Income Taxes on our Statement of Operations.
43
OLD DOMINION FREIGHT LINE, INC.
NOTES TO THE FINANCIAL STATEMENTS (CONTINUED)
Note 6. Related Person Transactions
Family Relationships
Each of Earl E. Congdon, John R. Congdon, David S. Congdon and John R. Congdon, Jr. are related to one another and served in various executive management positions and/or on our Board of Directors during 2011. We have entered into amended and restated employment agreements with Earl E. Congdon, John R. Congdon and David S. Congdon, which are incorporated by reference as exhibits to our Annual Report on Form 10-K. We regularly disclose the amount of compensation that we pay to these individuals in the proxy statement for our Annual Meeting of Shareholders.
Transactions with Old Dominion Truck Leasing, Inc.
Old Dominion Truck Leasing, Inc. (“Leasing”) is a North Carolina corporation whose voting stock is owned by an Earl E. Congdon Revocable Trust; the John R. Congdon Revocable Trust; and members of Earl E. Congdon’s and John R. Congdon’s families. Leasing is primarily engaged in the business of purchasing and leasing tractors, trailers and other vehicles. John R. Congdon is Chairman of the Board of Leasing, and Earl E. Congdon is Vice Chairman of the Board of Leasing. Since 1986, we have combined our requirements with Leasing for the purchase of tractors, trailers, equipment, parts, tires and fuel. We believe that the termination of this arrangement would not have a material adverse impact on our financial results.
We purchased $278,000, $242,000 and $231,000 of maintenance and other services from Leasing in 2011, 2010 and 2009, respectively. We believe that the prices we pay for such services are no more than what would be charged by unaffiliated third parties for the same quality of work, and we intend to continue to purchase maintenance and other services from Leasing, provided that Leasing’s prices continue to be favorable to us.
We also paid Leasing $86,000 and $114,000 for leased equipment in 2010 and 2009, respectively. These payments were for long-term leases for tractors used in our linehaul operations. We received no commission or other financial benefit from Leasing or any other party in connection with these lease transactions. We did not lease any equipment from Leasing in 2011.
We charged Leasing $18,000, $17,000 and $12,000 for the rental of property in 2011, 2010 and 2009, respectively. No other services were provided to Leasing for the years ended December 31, 2011, 2010 and 2009.
Split Dollar Life Insurance Policies
We are the owner of two split-dollar life insurance contracts insuring the life of John R. Congdon. The net cash surrender value for these policies was $6.6 million and $6.3 million at December 31, 2011 and 2010, respectively, and is included on our Balance Sheets under the caption “Other assets.” At December 31, 2011, these policies provided for an aggregate of $8.7 million in net death benefits due to the Company, of which we have endorsed $2.0 million to Mr. Congdon’s children.
Note 7. Employee Benefit Plans
Defined Contribution Plan
Substantially all employees meeting certain service requirements are eligible to participate in our 401(k) employee retirement plan. Employee contributions are limited to a percentage of their compensation, as defined in the plan. We make contributions based upon the greater of a percentage of employee contributions or ten percent of net income. Company contributions for 2011, 2010 and 2009 were $13.9 million, $7.6 million and $4.8 million, respectively.
44
OLD DOMINION FREIGHT LINE, INC.
NOTES TO THE FINANCIAL STATEMENTS (CONTINUED)
Deferred Compensation Plan
We maintain a nonqualified deferred compensation plan for the benefit of certain eligible employees whose contributions to the 401(k) employee retirement plan are limited due to provisions of the Internal Revenue Code. Participating employees may elect to defer receipt of a percentage of their compensation, as defined in the plan, and the deferred amount is credited to each participant’s deferred compensation account. The plan is not funded and the Company does not make a matching contribution to this plan. Although the plan is not funded, each participant is allowed to select one or more investments from the available options. Participant accounts are adjusted at the end of each fiscal quarter to reflect the performance of the selected investment options in which the participants’ accounts are deemed invested. The amounts owed to the participants totaled $24.6 million and $22.3 million at December 31, 2011 and 2010, respectively.
Note 8. Share-Based Compensation
On May 16, 2005, our Board of Directors approved, and the Company adopted, the Old Dominion Freight Line, Inc. Phantom Stock Plan, as amended effective January 1, 2009, May 18, 2009 and May 17, 2011 (the “Phantom Stock Plan”). Each share of phantom stock awarded to eligible employees under the Phantom Stock Plan represents a contractual right to receive an amount in cash equal to the fair market value of a share of our common stock on the settlement date, which generally is the earlier of the eligible employee’s (i) termination from the Company after reaching 55 years of age, (ii) death or (iii) disability. No shares of common stock will be issued pursuant to the Phantom Stock Plan, as the awards are settled in cash after the required vesting period has been satisfied and upon termination of employment. The maximum number of shares of phantom stock available for awards under the Phantom Stock Plan is 562,500, subject to any change in the outstanding shares of our common stock. Our Board of Directors approved the initial grant under this plan at its January 2006 meeting and have approved and awarded grants annually thereafter.
Phantom Stock Plan awards vest upon the earlier to occur of the following: the date of a change of control in our ownership; the fifth anniversary of the grant date of the award, provided the participant is employed by us on that date; the date of the participant’s death while employed by us; the date of the participant’s total disability; or the date the participant attains the age of 65 while employed by us. Awards that are not vested upon termination of employment are forfeited. If termination occurs prior to attaining the age of 55, all vested and unvested awards are generally forfeited unless the termination results from death or total disability. The Phantom Stock Plan does, however, provide the Board of Directors with discretionary authority to modify and/or accelerate the vesting of awards.
On May 28, 2008, our Board of Directors approved, and the Company adopted, the Old Dominion Freight Line, Inc. Director Phantom Stock Plan, as amended on April 1, 2011 (the “Director Phantom Stock Plan” and together with the Phantom Stock Plan, the “Phantom Plans”). Under the Director Phantom Stock Plan, each non-employee eligible director shall be granted an annual award of phantom shares equal to $50,000 on the grant date. Prior to the 2011 grant, the annual award to each non-employee eligible director was equal to $30,000 on the grant date. For each vested share, participants are entitled to an amount in cash equal to the fair market value of a share of our common stock the on date service as a director terminates for any reason. No shares of common stock will be issued pursuant to the Director Phantom Stock Plan, as the awards are settled in cash. Our Board of Directors approved the initial grant under this plan at its May 2008 meeting and have approved and awarded grants annually thereafter.
Director Phantom Stock Plan awards vest upon the earlier to occur of the following: the one-year anniversary of the grant date; the date of the first annual meeting of shareholders that occurs after the grant date provided the participant is still in service as a director; the date of a change of control in our ownership provided that the participant is still in service as a director; or the date of the participant’s death or total disability while still in service as a director. Awards that are not vested upon termination of service as a director are forfeited.
45
OLD DOMINION FREIGHT LINE, INC.
NOTES TO THE FINANCIAL STATEMENTS (CONTINUED)
A summary of the changes in the number of outstanding phantom stock awards during the year ended December 31, 2011 for the Phantom Plans is provided below. Of these awards, 134,584 and 124,994 phantom shares were vested at December 31, 2011 and 2010.
| Phantom Stock Plan |
Director Phantom Stock Plan |
|||||||
| Balance of shares outstanding at December 31, 2010 |
253,802 | 25,239 | ||||||
| Granted |
41,028 | 8,250 | ||||||
| Settled |
(13,381 | ) | 0 | |||||
|
|
|
|
|
|||||
| Balance of shares outstanding at December 31, 2011 |
281,449 | 33,489 | ||||||
|
|
|
|
|
|||||
Awards granted under the Phantom Plans are accounted for as a liability under The Financial Accounting Standards Board Accounting Standards Codification™ (“FASC”) 718, Compensation – Stock Compensation. FASC 718 requires changes in the fair value of our liability for the Phantom Plans to be recognized as compensation cost over the requisite service period for the percentage of requisite service rendered each period. Changes in the fair value of the liability that occur after the requisite service period are recognized as compensation cost during the period in which the changes occur. We remeasure the liability for the outstanding awards at the end of each reporting period based on the closing price of our common stock at that date, and the compensation cost is based on the change in fair value for each reporting period. The liability for these awards totaled $10.9 million and $7.2 million at December 31, 2011 and 2010, respectively. Compensation costs related to the Phantom Plans totaled $4.2 million, $4.4 million and $1.3 million for 2011, 2010 and 2009, respectively. Unrecognized compensation cost related to all unvested shares as of December 31, 2011 was $2.9 million based on the price of our common stock on that date.
Note 9. Commitments and Contingencies
We are involved in various legal proceedings and claims that have arisen in the ordinary course of our business that have not been fully adjudicated. Many of these are covered in whole or in part by insurance. Our management does not believe that these actions, when finally concluded and determined, will have a material adverse effect upon our financial position, liquidity or results of operations.
Note 10. Quarterly Financial Information (Unaudited)
A summary of our unaudited quarterly financial information for 2011 and 2010 is provided below. Our tonnage levels and revenue mix are subject to seasonal trends common in the motor carrier industry. Financial results in the first quarter are normally lower due to reduced shipments during the winter months. Harsh winter weather can also adversely impact our performance by reducing demand and increasing operating expenses.
| Quarter | ||||||||||||||||||||
| (In thousands, except per share data) |
First | Second | Third | Fourth | Total | |||||||||||||||
| 2011 |
||||||||||||||||||||
| Revenue |
$ | 422,679 | $ | 480,255 | $ | 494,475 | $ | 485,132 | $ | 1,882,541 | ||||||||||
| Operating income |
37,921 | 64,645 | 68,194 | 63,312 | 234,072 | |||||||||||||||
| Net income |
21,573 | 39,383 | 38,631 | 39,883 | 139,470 | |||||||||||||||
| Net income per share: |
||||||||||||||||||||
| Basic and diluted |
0.38 | 0.69 | 0.67 | 0.69 | 2.44 | |||||||||||||||
| 2010 |
||||||||||||||||||||
| Revenue |
$ | 317,795 | $ | 368,250 | $ | 395,981 | $ | 398,972 | $ | 1,480,998 | ||||||||||
| Operating income |
16,375 | 40,011 | 43,384 | 37,969 | 137,739 | |||||||||||||||
| Net income |
7,701 | 21,513 | 24,381 | 22,056 | 75,651 | |||||||||||||||
| Net income per share: |
||||||||||||||||||||
| Basic and diluted |
0.14 | 0.38 | 0.44 | 0.39 | 1.35 | |||||||||||||||
46
OLD DOMINION FREIGHT LINE, INC.
NOTES TO THE FINANCIAL STATEMENTS (CONTINUED)
Note 11. Subsequent Events
Management evaluated all subsequent events and transactions through the issuance date of these financial statements, and concluded that no subsequent events or transactions have occurred that require recognition or disclosure in our financial statements.
47
Report of Independent Registered Public Accounting Firm
The Board of Directors and Shareholders of
Old Dominion Freight Line, Inc.
We have audited the accompanying balance sheets of Old Dominion Freight Line, Inc. as of December 31, 2011 and 2010, and the related statements of operations, changes in shareholders’ equity, and cash flows for each of the three years in the period ended December 31, 2011. Our audits also included the financial statement schedule of Old Dominion Freight Line, Inc. listed in Item 15(a)(2). These financial statements and schedule are the responsibility of the Company’s management. Our responsibility is to express an opinion on these financial statements and schedule based on our audits.
We conducted our audits in accordance with the standards of the Public Company Accounting Oversight Board (United States). Those standards require that we plan and perform the audit to obtain reasonable assurance about whether the financial statements are free of material misstatement. An audit includes examining, on a test basis, evidence supporting the amounts and disclosures in the financial statements. An audit also includes assessing the accounting principles used and significant estimates made by management, as well as evaluating the overall financial statement presentation. We believe that our audits provide a reasonable basis for our opinion.
In our opinion, the financial statements referred to above present fairly, in all material respects, the financial position of Old Dominion Freight Line, Inc. at December 31, 2011 and 2010, and the results of its operations and its cash flows for each of the three years in the period ended December 31, 2011, in conformity with U.S. generally accepted accounting principles. Also, in our opinion, the financial statement schedule, when considered in relation to the basic financial statements taken as a whole, presents fairly in all material respects the information set forth therein.
We also have audited, in accordance with the standards of the Public Company Accounting Oversight Board (United States), Old Dominion Freight Line, Inc.’s internal control over financial reporting as of December 31, 2011, based on criteria established in Internal Control – Integrated Framework issued by the Committee of Sponsoring Organizations of the Treadway Commission and our report dated February 29, 2012 expressed an unqualified opinion thereon.
/s/ Ernst & Young LLP
Charlotte, North Carolina
February 29, 2012
48
ITEM 9. CHANGES IN AND DISAGREEMENTS WITH ACCOUNTANTS ON ACCOUNTING AND FINANCIAL DISCLOSURE
None.
ITEM 9A. CONTROLS AND PROCEDURES
| a) | Evaluation of disclosure controls and procedures |
As of the end of the period covered by this report, our management has conducted an evaluation, with the participation of our Chief Executive Officer (“CEO”) and Chief Financial Officer (“CFO”), of the effectiveness of our disclosure controls and procedures in accordance with Rule 13a-15 under the Securities Exchange Act of 1934, as amended (the “Exchange Act”). Based on this evaluation as of the end of the period covered by this report, our CEO and CFO concluded that, as of such date, our disclosure controls and procedures were effective to ensure that information required to be disclosed by us in the reports that we file or submit under the Exchange Act is (i) accumulated and communicated to our management, including our CEO and CFO, as appropriate to allow timely decisions regarding required disclosure, and (ii) recorded, processed, summarized and reported within the time periods specified in the SEC’s rules and forms.
| b) | Management’s annual report on internal control over financial reporting |
Management is responsible for establishing and maintaining adequate internal control over financial reporting in accordance with Exchange Act Rule 13a-15(f). Management has conducted an evaluation, with the participation of our CEO and CFO, of the effectiveness of our internal control over financial reporting as of December 31, 2011 based on the framework in Internal Control – Integrated Framework issued by the Committee of Sponsoring Organizations of the Treadway Commission. Management concluded that our internal control over financial reporting was effective as of December 31, 2011, based on our evaluation under the framework in Internal Control – Integrated Framework.
A control system, no matter how well conceived and operated, can provide only reasonable, not absolute, assurance that the objectives of the control system are met. Further, in designing a control system, we must take into account the benefits of controls relative to their costs. Because of the inherent limitations in all control systems, no evaluation of controls can provide absolute assurance that all control issues and instances of fraud, if any, within the Company have been detected.
The effectiveness of our internal control over financial reporting as of December 31, 2011 has been audited by Ernst & Young LLP, an independent registered public accounting firm, as stated in their report which is included herein.
| c) | Changes in internal control over financial reporting |
There were no changes in our internal control over financial reporting that occurred during the last quarter of the period covered by this report that have materially affected, or are reasonably likely to materially affect, our internal control over financial reporting.
49
Report of Independent Registered Public Accounting Firm
The Board of Directors and Shareholders of
Old Dominion Freight Line, Inc.
We have audited Old Dominion Freight Line, Inc.’s internal control over financial reporting as of December 31, 2011, based on criteria established in Internal Control – Integrated Framework issued by the Committee of Sponsoring Organizations of the Treadway Commission (the COSO criteria). Old Dominion Freight Line, Inc.’s management is responsible for maintaining effective internal control over financial reporting, and for its assessment of the effectiveness of internal control over financial reporting included in the accompanying Management’s Annual Report on Internal Control over Financial Reporting. Our responsibility is to express an opinion on the Company’s internal control over financial reporting based on our audit.
We conducted our audit in accordance with the standards of the Public Company Accounting Oversight Board (United States). Those standards require that we plan and perform the audit to obtain reasonable assurance about whether effective internal control over financial reporting was maintained in all material respects. Our audit included obtaining an understanding of internal control over financial reporting, assessing the risk that a material weakness exists, testing and evaluating the design and operating effectiveness of internal control based on the assessed risk, and performing such other procedures as we considered necessary in the circumstances. We believe that our audit provides a reasonable basis for our opinion.
A company’s internal control over financial reporting is a process designed to provide reasonable assurance regarding the reliability of financial reporting and the preparation of financial statements for external purposes in accordance with generally accepted accounting principles. A company’s internal control over financial reporting includes those policies and procedures that (1) pertain to the maintenance of records that, in reasonable detail, accurately and fairly reflect the transactions and dispositions of the assets of the company; (2) provide reasonable assurance that transactions are recorded as necessary to permit preparation of financial statements in accordance with generally accepted accounting principles, and that receipts and expenditures of the company are being made only in accordance with authorizations of management and directors of the company; and (3) provide reasonable assurance regarding prevention or timely detection of unauthorized acquisition, use or disposition of the company’s assets that could have a material effect on the financial statements.
Because of its inherent limitations, internal control over financial reporting may not prevent or detect misstatements. Also, projections of any evaluation of effectiveness to future periods are subject to the risk that controls may become inadequate because of changes in conditions, or that the degree of compliance with the policies or procedures may deteriorate.
In our opinion, Old Dominion Freight Line, Inc. maintained, in all material respects, effective internal control over financial reporting as of December 31, 2011, based on the COSO criteria.
We also have audited, in accordance with the standards of the Public Company Accounting Oversight Board (United States), the balance sheets of Old Dominion Freight Line, Inc. as of December 31, 2011 and 2010, and the related statements of operations, changes in shareholders’ equity, and cash flows for each of the three years in the period ended December 31, 2011 and our report dated February 29, 2012 expressed an unqualified opinion thereon.
/s/ Ernst & Young LLP
Charlotte, North Carolina
February 29, 2012
50
None.
ITEM 10. DIRECTORS, EXECUTIVE OFFICERS AND CORPORATE GOVERNANCE
The information required by Item 10 of Form 10-K will appear in the Company’s proxy statement for its 2012 Annual Meeting of Shareholders under the captions “Proposal 1 – Election of Directors,” “Executive Officers,” “Section 16(a) Beneficial Ownership Reporting Compliance,” “Corporate Governance – Attendance and Committees of the Board – Audit Committee,” and “Corporate Governance – Code of Business Conduct,” and the information therein is incorporated herein by reference.
ITEM 11. EXECUTIVE COMPENSATION
The information required by Item 11 of Form 10-K will appear in the Company’s proxy statement for its 2012 Annual Meeting of Shareholders under the captions “Corporate Governance – Compensation Committee Interlocks and Insider Participation,” “Compensation Discussion and Analysis,” “Compensation Committee Report,” “Executive Compensation,” and “Director Compensation,” and the information therein is incorporated herein by reference.
ITEM 12. SECURITY OWNERSHIP OF CERTAIN BENEFICIAL OWNERS AND MANAGEMENT AND RELATED STOCKHOLDER MATTERS
The information required by Item 12 of Form 10-K will appear in the Company’s proxy statement for its 2012 Annual Meeting of Shareholders under the caption “Security Ownership of Management and Certain Beneficial Owners,” and the information therein is incorporated herein by reference.
ITEM 13. CERTAIN RELATIONSHIPS AND RELATED TRANSACTIONS, AND DIRECTOR INDEPENDENCE
The information required by Item 13 of Form 10-K will appear in the Company’s proxy statement for the 2012 Annual Meeting of Shareholders under the captions “Corporate Governance – Independent Directors” and “Related Person Transactions,” and the information therein is incorporated herein by reference.
ITEM 14. PRINCIPAL ACCOUNTING FEES AND SERVICES
The information required by Item 14 of Form 10-K will appear in the Company’s proxy statement for its 2012 Annual Meeting of Shareholders under the captions “Corporate Governance – Audit Committee Pre-Approval Policies and Procedures” and “Independent Registered Public Accounting Firm Fees and Services,” and the information therein is incorporated herein by reference.
51
ITEM 15. EXHIBITS, FINANCIAL STATEMENT SCHEDULES
| (a)(1) | Financial Statements. |
The following financial statements of Old Dominion Freight Line, Inc. are included in Item 8:
Balance Sheets – December 31, 2011 and December 31, 2010
Statements of Operations – Years ended December 31, 2011, December 31, 2010 and December 31, 2009
Statements of Changes in Shareholders’ Equity – Years ended December 31, 2011, December 31, 2010 and December 31, 2009
Statements of Cash Flows – Years ended December 31, 2011, December 31, 2010 and December 31, 2009
Notes to the Financial Statements
| (a)(2) | Financial Statement Schedules. |
The Schedule II – Valuation and Qualifying Accounts schedule of Old Dominion Freight Line, Inc. is included below:
Schedule II
Old Dominion Freight Line, Inc.
Valuation and Qualifying Accounts
| (In thousands) |
||||||||||||||||
| Allowance for Uncollectible Accounts(1) | ||||||||||||||||
| Year Ended December 31, |
Balance at Beginning of Period |
Charged to Costs and Expenses |
Deductions(2) | Balance at End of Period |
||||||||||||
| 2009 |
$ | 10,000 | $ | 4,493 | $ | 4,294 | $ | 10,199 | ||||||||
| 2010 |
$ | 10,199 | $ | 545 | $ | 3,944 | $ | 6,800 | ||||||||
| 2011 |
$ | 6,800 | $ | 3,200 | $ | 2,723 | $ | 7,277 | ||||||||
| (1) | This table does not include any allowances for revenue adjustments that result from billing corrections, customer allowances, money-back service guarantees and other miscellaneous revenue adjustments that are recorded in our revenue from operations. |
| (2) | Uncollectible accounts written off, net of recoveries. |
All other schedules for which provision is made in the applicable accounting regulations of the SEC are not required under the instructions or are inapplicable and, therefore, have been omitted.
| (a)(3) | Exhibits Filed. |
The exhibits listed in the accompanying Exhibit Index are filed as a part of this report.
| (b) | Exhibits. |
See Exhibit Index.
| (c) | Separate Financial Statements and Schedules. |
None.
52
Pursuant to the requirements of Section 13 or 15(d) of the Securities Exchange Act of 1934, the registrant has duly caused this report to be signed on its behalf by the undersigned, thereunto duly authorized.
| OLD DOMINION FREIGHT LINE, INC. | ||||||
| Dated: February 29, 2012 | By: | /s/ DAVID S. CONGDON | ||||
| David S. Congdon | ||||||
| President and Chief Executive Officer | ||||||
Pursuant to the requirements of the Securities Exchange Act of 1934, this report has been signed below by the following persons on behalf of the registrant and in the capacities and on the dates indicated:
| Name and Signature |
Position |
Date | ||
| /s/ EARL E. CONGDON |
Executive Chairman of the | February 29, 2012 | ||
| Earl E. Congdon | Board of Directors | |||
| /s/ DAVID S. CONGDON |
Director, President and | February 29, 2012 | ||
| David S. Congdon | Chief Executive Officer (Principal Executive Officer) |
|||
| /s/ JOHN R. CONGDON |
Vice Chairman of the Board | February 29, 2012 | ||
| John R. Congdon | and Senior Vice President | |||
| /s/ J. PAUL BREITBACH |
Director | February 29, 2012 | ||
| J. Paul Breitbach | ||||
| /s/ JOHN R. CONGDON, JR. |
Director | February 29, 2012 | ||
| John R. Congdon, Jr. | ||||
| /s/ ROBERT G. CULP, III |
Director | February 29, 2012 | ||
| Robert G. Culp, III | ||||
| /s/ JOHN D. KASARDA |
Director | February 29, 2012 | ||
| John D. Kasarda | ||||
| /s/ LEO H. SUGGS |
Director | February 29, 2012 | ||
| Leo H. Suggs | ||||
| /s/ D. MICHAEL WRAY |
Director | February 29, 2012 | ||
| D. Michael Wray | ||||
| /s/ J. WES FRYE |
Senior Vice President – Finance | February 29, 2012 | ||
| J. Wes Frye | and Chief Financial Officer (Principal Financial Officer) |
|||
| /s/ JOHN P. BOOKER III |
Vice President – Controller | February 29, 2012 | ||
| John P. Booker III | (Principal Accounting Officer) | |||
53
TO ANNUAL REPORT ON FORM 10-K
OLD DOMINION FREIGHT LINE, INC.
FOR YEAR ENDED DECEMBER 31, 2011
| Exhibit No. |
Description | |
| 3.1.1(c) |
Amended and Restated Articles of Incorporation of Old Dominion Freight Line, Inc. (as amended July 30, 2004) | |
| 3.2(l) |
Amended and Restated Bylaws of Old Dominion Freight Line, Inc. | |
| 4.1(a) |
Specimen certificate of Common Stock | |
| 4.6.10(d) |
Note Purchase Agreement among Old Dominion Freight Line, Inc. and the Purchasers set forth in Schedule A thereto, dated as of February 25, 2005 | |
| 4.8(e) |
Credit Agreement among Wachovia Bank, National Association, as Agent, Bank of America, N.A., Branch Banking & Trust Company and Old Dominion Freight Line, Inc., dated September 22, 2005 | |
| 4.8.1(h) |
First Amendment to the Credit Agreement among Wachovia Bank, National Association, as Agent, Bank of America, N.A., Branch Banking & Trust Company and Old Dominion Freight Line, Inc., dated April 21, 2006. | |
| 4.9(h) |
Note Purchase Agreement among Old Dominion Freight Line, Inc. and the Purchasers set forth in Schedule A thereto, dated as of April 25, 2006. | |
| 4.10(i) |
Amended and Restated Credit Agreement among Wachovia Bank, National Association, as Administrative Agent; the Lenders named therein; and Old Dominion Freight Line, Inc., dated as of August 10, 2006 | |
| 4.10.1(q) |
Amendment No. 1 to Amended and Restated Credit Agreement among Old Dominion Freight Line, Inc., the Lenders named therein and Wells Fargo Bank, National Association, as Agent, dated as of December 31, 2010 | |
| 4.11(q) |
Note Purchase Agreement by and among Old Dominion Freight Line, Inc. and the Purchasers set forth in Schedule A thereto, dated as of January 3, 2011 | |
| 4.12(t) |
Second Amended and Restated Credit Agreement among Wells Fargo Bank, National Association, as Administrative Agent; the Lenders named therein; and Old Dominion Freight Line, Inc., dated as of August 10, 2011 | |
| 10.17.1(b)* |
Employment Agreement by and between Old Dominion Freight Line, Inc. and Earl E. Congdon, effective as of June 1, 2004 | |
| 10.17.2(b)* |
Employment Agreement by and between Old Dominion Freight Line, Inc. and John R. Congdon, effective as of June 1, 2004 | |
| 10.17.3(b)* |
Employment Agreement by and between Old Dominion Freight Line, Inc. and David S. Congdon, effective as of June 1, 2004 | |
| 10.17.6(j)* |
Amended and Restated Employment Agreement between Old Dominion Freight Line, Inc. and Earl E. Congdon, effective as of June 1, 2008 | |
| 10.17.7(j)* |
Amended and Restated Employment Agreement between Old Dominion Freight Line, Inc. and John R. Congdon, effective as of June 1, 2008 | |
| 10.17.8(j)* |
Amended and Restated Employment Agreement between Old Dominion Freight Line, Inc. and David S. Congdon, effective as of June 1, 2008 | |
54
| Exhibit No. |
Description | |
| 10.17.10(p)* |
First Amendment to Amended and Restated Employment Agreement, effective as of May 31, 2010, by and between Old Dominion Freight Line, Inc. and Earl E. Congdon | |
| 10.17.11(p)* |
First Amendment to Amended and Restated Employment Agreement, effective as of May 31, 2010, by and between Old Dominion Freight Line, Inc. and John R. Congdon | |
| 10.17.12(v)* |
Second Amendment to Amended and Restated Employment Agreement, effective as of May 31, 2012, by and between Old Dominion Freight Line, Inc. and Earl E. Congdon | |
| 10.17.13(v)* |
Second Amendment to Amended and Restated Employment Agreement, effective as of May 31, 2012, by and between Old Dominion Freight Line, Inc. and John R. Congdon | |
| 10.18.3(k)* |
Old Dominion Freight Line, Inc. Director Phantom Stock Plan | |
| 10.18.4(k)* |
Form of Old Dominion Freight Line, Inc. Director Phantom Stock Plan Award Agreement | |
| 10.18.5(m)* |
Non-Executive Director Compensation Structure, effective January 1, 2008 | |
| 10.18.6(s)* |
Non-Executive Director Compensation Structure, effective January 1, 2011 | |
| 10.18.7(s)* |
Old Dominion Freight Line, Inc. Director Phantom Stock Plan, as amended through April 1, 2011 | |
| 10.19.1(f)* |
Old Dominion Freight Line, Inc. Phantom Stock Plan, effective as of May 16, 2005 | |
| 10.19.2(f)* |
Old Dominion Freight Line, Inc. Change of Control Severance Plan for Key Executives, effective as of May 16, 2005 | |
| 10.19.3(g)* |
Form of Old Dominion Freight Line, Inc. Phantom Stock Award Agreement | |
| 10.19.4(m)* |
Old Dominion Freight Line, Inc. Phantom Stock Plan, effective as of January 1, 2009 | |
| 10.19.5(m)* |
Old Dominion Freight Line, Inc. Change of Control Severance Plan for Key Executives, effective as of January 1, 2009 | |
| 10.19.6(n)* |
Amendment to Old Dominion Freight Line, Inc. Phantom Stock Plan, effective as of May 18, 2009 | |
| 10.19.7(u)* |
2011 Declaration of Amendment to Old Dominion Freight Line, Inc. Phantom Stock Plan, effective as of May 17, 2011 | |
| 10.20.1(o)* |
2006 Nonqualified Deferred Compensation Plan of Old Dominion Freight Line, Inc., effective January 1, 2006 (as restated and effective January 1, 2009) | |
| 10.20.2(g)* |
Form of Annual Salary and Bonus Deduction Agreement | |
| 10.20.3* |
Second Amendment to 2006 Nonqualified Deferred Compensation Plan of Old Dominion Freight Line, Inc., as amended, effective November 10, 2011 | |
| 10.21(j)* |
Old Dominion Freight Line, Inc. Performance Incentive Plan | |
| 10.22 (r) |
At-The-Market Equity Offering Sales Agreement, dated February 2, 2011, between Old Dominion Freight Line, Inc. and Stifel, Nicolaus & Company, Incorporated | |
| 23.1 |
Consent of Ernst & Young LLP | |
| 31.1 |
Certification Pursuant to Rule 13a-14(a) or 15d-14(a) of the Exchange Act, as Adopted Pursuant to Section 302 of the Sarbanes-Oxley Act of 2002 | |
55
| Exhibit No. |
Description | |
| 31.2 |
Certification Pursuant to Rule 13a-14(a) or 15d-14(a) of the Exchange Act, as Adopted Pursuant to Section 302 of the Sarbanes-Oxley Act of 2002 | |
| 32.1 |
Certification Pursuant to 18 U.S.C Section 1350, as Adopted Pursuant to Section 906 of the Sarbanes-Oxley Act of 2002 | |
| 32.2 |
Certification Pursuant to 18 U.S.C Section 1350, as Adopted Pursuant to Section 906 of the Sarbanes-Oxley Act of 2002 | |
| 101** |
The following financial information from our Annual Report on Form 10-K for the year ended December 31, 2011, filed on February 29, 2012, formatted in XBRL (eXtensible Business Reporting Language) includes: (i) the Balance Sheets at December 31, 2011 and December 31, 2010, (ii) the Statements of Operations for the years ended December 31, 2011, December 31, 2010 and December 31, 2009, (iii) the Statements of Changes in Shareholders’ Equity for the years ended December 31, 2011, December 31, 2010 and December 31, 2009, (iv) the Statements of Cash Flows for the years ended December 31, 2011, December 31, 2010 and December 31, 2009, and (v) the Notes to the Financial Statements | |
| (a) | Incorporated by reference to the exhibit of the same number contained in the Company’s Registration Statement on Form S-1 filed under the Securities Act of 1933, as amended (SEC File: 33-42631) |
| (b) | Incorporated by reference to the exhibit of the same number contained in the Company’s Current Report on Form 8-K filed on June 10, 2004 |
| (c) | Incorporated by reference to the exhibit of the same number contained in the Company’s Quarterly Report on Form 10-Q for the quarter ended June 30, 2004, filed on August 6, 2004 |
| (d) | Incorporated by reference to the exhibit of the same number contained in the Company’s Annual Report on Form 10-K for the year ended December 31, 2004, filed on March 16, 2005 |
| (e) | Incorporated by reference to the exhibit of the same number contained in the Company’s Current Report on Form 8-K filed on September 28, 2005 |
| (f) | Incorporated by reference to the exhibit of the same number contained in the Company’s Current Report on Form 8-K filed on May 20, 2005 |
| (g) | Incorporated by reference to the exhibit of the same number contained in the Company’s Current Report on Form 8-K filed on February 21, 2006 |
| (h) | Incorporated by reference to the exhibit of the same number contained in the Company’s Current Report on Form 8-K filed on May 1, 2006 |
| (i) | Incorporated by reference to the exhibit of the same number contained in the Company’s Current Report on Form 8-K filed on August 16, 2006 |
| (j) | Incorporated by reference to the exhibit of the same number contained in the Company’s Current Report on Form 8-K filed on June 3, 2008 |
| (k) | Incorporated by reference to the exhibit of the same number contained in the Company’s Quarterly Report on Form 10-Q for the quarter ended June 30, 2008, filed on August 8, 2008 |
| (l) | Incorporated by reference to the exhibit of the same number contained in the Company’s Current Report on Form 8-K filed on May 21, 2009 |
| (m) | Incorporated by reference to the exhibit of the same number contained in the Company’s Annual Report on Form 10-K for the year ended December 31, 2008, filed on March 2, 2009 |
| (n) | Incorporated by reference to Exhibit 10.19.4 contained in the Company’s Quarterly Report on Form 10-Q for the quarter ended June 30, 2009, filed on August 7, 2009 |
| (o) | Incorporated by reference to the exhibit of the same number contained in the Company’s Annual Report on Form 10-K for the year ended December 31, 2009 |
| (p) | Incorporated by reference to the exhibit of the same number contained in the Company’s Current Report on Form 8-K filed on May 28, 2010 |
| (q) | Incorporated by reference to the exhibit of the same number contained in the Company’s Current Report on Form 8-K filed on January 6, 2011 |
| (r) | Incorporated by reference to the exhibit of the same number contained in the Company’s Current Report on Form 8-K filed on February 2, 2011 |
| (s) | Incorporated by reference to the exhibit of the same number contained in the Company’s Quarterly Report on Form 10-Q for the quarter ended March 31, 2011, filed on May 9, 2011 |
| (t) | Incorporated by reference to the exhibit of the same number contained in the Company’s Current Report on Form 8-K filed on August 16, 2011 |
56
| (u) | Incorporated by reference to the exhibit of the same number contained in the Company’s Quarterly Report on Form 10-Q for the quarter ended September 30, 2011, filed on November 8, 2011 |
| (v) | Incorporated by reference to the exhibit of the same number contained in the Company’s Current Report on Form 8-K filed on February 6, 2012 |
| * | Denotes an executive compensation plan or agreement |
| ** | The XBRL-related information has been furnished electronically herewith. This exhibit, regardless of whether it is an exhibit to a document incorporated by reference into any of our filings and except to the extent specifically stated otherwise, is deemed not filed or part of a registration statement or prospectus for purposes of sections 11 or 12 of the Securities Act of 1933, as amended, is deemed not filed for purposes of section 18 of the Securities Exchange Act of 1934, as amended, and otherwise is not subject to liability under these sections. |
Our SEC file number reference for documents filed with the SEC pursuant to the Securities Exchange Act of 1934, as amended, is 000-19582.
57