UNITED STATES
SECURITIES AND EXCHANGE COMMISSION
Washington, D.C. 20549
FORM 10-K
(Mark One)
| x | ANNUAL REPORT PURSUANT TO SECTION 13 OR 15(d) OF THE SECURITIES EXCHANGE ACT OF 1934 |
For the fiscal year ended December 31, 2007
OR
| ¨ | TRANSITION REPORT PURSUANT TO SECTION 13 OR 15(d) OF THE SECURITIES EXCHANGE ACT OF 1934 |
For the transition period from to .
Commission File Number: 0-19582
OLD DOMINION FREIGHT LINE, INC.
(Exact name of registrant as specified in its charter)
| VIRGINIA | 56-0751714 | |
| (State or other jurisdiction of | (I.R.S. Employer | |
| incorporation or organization) | Identification No.) |
500 Old Dominion Way
Thomasville, NC 27360
(Address of principal executive offices)
(Zip Code)
(336) 889-5000 (Registrant’s telephone number, including area code)
Securities registered pursuant to Section 12(b) of the Act:
| Title of each class |
Name of each exchange on which registered | |
| Common Stock ($0.10 par value) | The NASDAQ Stock Market LLC |
Securities registered pursuant to Section 12(g) of the Act: None
Indicate by check mark if the registrant is a well-known seasoned issuer, as defined in Rule 405 of the Securities Act. Yes x No ¨
Indicate by check mark if the registrant is not required to file reports pursuant to Section 13 or Section 15(d) of the Act. Yes ¨ No x
Indicate by check mark whether the registrant (1) has filed all reports required to be filed by Section 13 or 15(d) of the Securities Exchange Act of 1934 during the preceding 12 months (or for such shorter period that the registrant was required to file such reports), and (2) has been subject to such filing requirements for the past 90 days. Yes x No ¨
Indicate by check mark if disclosure of delinquent filers pursuant to Item 405 of Regulation S-K is not contained herein, and will not be contained, to the best of the registrant’s knowledge, in definitive proxy or information statements incorporated by reference in Part III of this Form 10-K or any amendment to this Form 10-K. ¨
Indicate by check mark whether the registrant is a large accelerated filer, an accelerated filer, a non-accelerated filer, or a smaller reporting company. See the definitions of “large accelerated filer,” “accelerated filer” and “smaller reporting company” in Rule 12b-2 of the Exchange Act. (Check one).
| Large accelerated filer x |
Accelerated filer ¨ | |
| Non-accelerated filer ¨ (Do not check if a smaller reporting company) |
Smaller reporting company ¨ |
Indicate by check mark whether the registrant is a shell company (as defined in Rule 12b-2 of the Act). Yes ¨ No x
The aggregate market value of voting stock held by nonaffiliates of the registrant as of June 30, 2007 was $694,992,776, based on the closing sales price as reported on the NASDAQ Global Select Market.
As of February 28, 2008, the registrant had 37,284,675 outstanding shares of Common Stock ($0.10 par value).
DOCUMENTS INCORPORATED BY REFERENCE
Portions of the Company’s Proxy Statement for the 2008 Annual Meeting of Shareholders are incorporated by reference into Part III of this report.
Forward-looking statements in this report, including, without limitation, statements relating to future events or our future financial performance, appear in Item 7, “Management’s Discussion and Analysis of Financial Condition and Results of Operations” in this Annual Report and in other written and oral statements made by or on behalf of us, including, without limitation, statements relating to our goals, strategies, expectations, competitive environment, regulation and availability of resources. Such forward-looking statements are made pursuant to the safe harbor provisions of the Private Securities Litigation Reform Act of 1995. Investors are cautioned that such forward-looking statements involve risks and uncertainties that could cause actual events and results to be materially different from those expressed or implied herein, including, but not limited to, the risk factors detailed in this Annual Report.
Unless the context requires otherwise, references in this report to “Old Dominion”, the “Company”, “we”, “us” and “our” refer to Old Dominion Freight Line, Inc.
General
We are a leading national less-than-truckload (“LTL”) motor carrier providing multi-regional service among six regions in the United States and next-day and second-day service within each of these regions. We operate as one business segment and offer an expanding array of innovative products and services through our four branded product groups, OD-Domestic, OD-Expedited, OD-Global and OD-Technology. At February 28, 2008, we provided full-state coverage to 39 of the 48 states that we served directly within the Southeast, Gulf Coast, Northeast, Midwest, Central and West regions of the country. We plan to continue to expand our service center network, as opportunities arise, to achieve our strategic goal of providing full-state coverage throughout the continental United States. These additions should provide a platform for future growth and ensure that our service center network has sufficient capacity. In addition to our domestic LTL services, we offer container delivery services and assembly and distribution services to and from all of North America, Central America, South America and the Far East. We also offer a broad range of expedited and logistical services for both our domestic and global markets.
We have grown substantially over the last several years through strategic acquisitions and internal growth. Prior to 1995, we provided inter-regional service to major metropolitan areas from, and regional service within, the Southeast region of the United States. Since 1995, we have expanded our infrastructure to provide next-day and second-day service within four additional regions as well as expanded inter-regional service among those regions. From 1995 through February 28, 2008, we increased our number of service centers from 53 to 204 and our states directly served from 21 to 48. We believe that our present infrastructure will enable us to increase freight density, which is the volume of freight moving through our network, and thereby improve our profitability.
We are committed to providing our customers with high quality service. We provide consistent customer service from a single organization offering our customers information and pricing from one point of contact. Our multi-regional competitors that offer inter-regional service typically do so through independent companies or with separate points of contact within different operating segments, which can result in inconsistent service and pricing, as well as poor shipment visibility. Our integrated structure allows us to offer our customers consistent and continuous service across all areas of operations and service products.
Old Dominion was founded in 1934 and incorporated in Virginia in 1950. Please refer to the Balance Sheets and Statements of Operations included in Item 8 of this report for information regarding our total assets, revenue from operations and net income.
3
Our Industry
Trucks provide transportation services to virtually every industry operating in the United States and generally offer higher levels of reliability and faster transit times than other surface transportation options. The trucking industry is comprised principally of two types of motor carriers: truckload and LTL. Truckload carriers generally provide an entire trailer to one customer from origin to destination. LTL carriers pick up multiple shipments from multiple customers on a single truck and then route the goods through service centers where freight may be transferred to other trucks with similar destinations for delivery.
In contrast to truckload carriers, LTL motor carriers require expansive networks of local pickup and delivery service centers, as well as larger breakbulk, or hub, facilities. The significant capital that LTL motor carriers must commit to create and maintain a network of service centers and a fleet of tractors and trailers makes it difficult for start-up or small operations to effectively compete with established companies. In addition, successful LTL motor carriers generally employ, and continuously update, a high level of technology to provide information to customers and to reduce operating costs.
Service Center Operations
At December 31, 2007, we conducted operations through 192 service center locations, of which we own 97 and lease 95. We operate major breakbulk facilities in Atlanta, Georgia; Rialto, California; Indianapolis, Indiana; Greensboro, North Carolina; Harrisburg, Pennsylvania; Memphis and Morristown, Tennessee; and Dallas, Texas, while using some smaller service centers for limited breakbulk activity in order to serve next-day markets. Our service centers are strategically located in six regions of the country to provide the highest quality service and minimize freight rehandling costs.
Each of our service centers is responsible for the pickup and delivery of freight for its service area. Each service center loads outbound freight by destination the day it is picked up. All inbound freight received by the service center in the evening or during the night is scheduled for local delivery the next business day, unless a customer requests a different delivery schedule. Our management reviews the productivity and service performance of each service center on a daily basis to ensure quality service and efficient operations.
While we have established primary responsibility for customer service at the local service center level, our customers may access information and initiate transactions through several different gateways such as our website, electronic data interchange, automated voice response systems, automated fax systems or through our customer service department located at the corporate office. Our systems offer direct access to information such as freight tracking, shipping documents, rate quotes, rate databases and account activity. These centralized systems and customer service department provide our customers with a single point of contact to access information across all areas of our operations and service products.
Linehaul Transportation
Linehaul dispatchers are centralized at our corporate headquarters and control the movement of freight among service centers through integrated freight movement systems. We also utilize load-planning software to optimize efficiencies in our linehaul operations. Our senior management continuously monitors freight movements, transit times, load factors and other productivity measurements to ensure that we maintain our highest levels of service and efficiency.
We utilize scheduled routes, and additional linehaul dispatches as necessary, to meet our published service standards. In addition, we lower our cost structure by maintaining flexible work force rules and by primarily using twin 28-foot trailers in our linehaul operations. The use of twin 28-foot trailers permits us to transport freight directly from its point of origin to destination with minimal unloading and reloading, which also reduces cargo loss and damage expenses. We also utilize long-combination vehicles, such as triple 28-foot trailers and combinations of 48-foot and 28-foot trailers, in states where permitted. Twin trailers and long-combination vehicles permit more freight to be hauled behind a tractor than could otherwise be hauled by one large trailer.
4
Tractors, Trailers and Maintenance
At December 31, 2007, we operated 5,016 tractors. We generally use new tractors in linehaul operations for approximately three to five years and then transfer those tractors to pickup and delivery operations for the remainder of the assets’ useful lives. In a number of our service centers, tractors perform pickup and delivery functions during the day and linehaul functions at night to maximize tractor utilization.
At December 31, 2007, we operated a fleet of 19,513 trailers. We primarily purchase new trailers for our operations; however, we occasionally purchase pre-owned equipment meeting our specifications from other trucking companies.
We have also acquired tractors and trailers through our acquisition of business assets from other carriers. The purchase of pre-owned equipment can provide an excellent value, but can increase our fleet’s average age. The table below reflects, as of December 31, 2007, the average age of our tractors and trailers:
| Type of equipment (categorized by primary use) |
Number of units |
Average age | ||
| Linehaul tractors |
3,376 | 2.3 | ||
| Pickup and delivery tractors |
1,640 | 7.4 | ||
| Pickup and delivery trucks |
99 | 3.1 | ||
| Linehaul trailers |
14,001 | 7.4 | ||
| Pickup and delivery trailers |
5,512 | 11.3 |
We develop certain specifications for tractors and trailers, the production and purchase of which are negotiated with several manufacturers. These purchases are planned well in advance of anticipated delivery dates in order to accommodate manufacturers’ production schedules. We believe that there is sufficient capacity among suppliers to ensure an uninterrupted supply of equipment to support our operations and planned growth.
The table below sets forth our capital expenditures for tractors and trailers for the years ended December 31, 2007, 2006 and 2005. Our capital expenditures for tractors and trailers in 2007 provided the capacity to support our continued growth and geographic expansion and, to a lesser extent, to replace equipment as part of our normal replacement cycle.
| Year ended December 31, | |||||||||
| (In thousands) |
2007 | 2006 | 2005 | ||||||
| Tractors |
$ | 52,807 | $ | 59,759 | $ | 50,457 | |||
| Trailers |
43,793 | 49,209 | 52,949 | ||||||
| Total |
$ | 96,600 | $ | 108,968 | $ | 103,406 | |||
At December 31, 2007, we had major maintenance operations at our service centers in Los Angeles and Rialto, California; Denver, Colorado; Atlanta, Georgia; Chicago, Illinois; Indianapolis, Indiana; Kansas City and Parsons, Kansas; Jersey City, New Jersey; Greensboro, North Carolina; Columbus, Ohio; Harrisburg, Pennsylvania; Morristown and Memphis, Tennessee; Dallas, Texas; and Salt Lake City, Utah. In addition, eleven other service center locations are equipped to perform routine and preventive maintenance and repairs on our equipment.
We have established maintenance policies and procedures. Linehaul tractors are routed to appropriate maintenance facilities at designated mileage or time intervals, depending upon how the equipment was utilized. Pickup and delivery tractors and trailers are scheduled for maintenance every 90 days.
5
Marketing and Customers
At December 31, 2007, we had a sales staff of 459 employees. We compensate our sales force, in part, based upon revenue generated, Company and service center profitability and on-time service performance, which we believe helps to motivate our employees to achieve our service, growth and profitability objectives.
We utilize a computerized freight costing model to determine the price level at which a particular shipment of freight will be profitable. We can modify elements of this freight costing model to simulate the actual conditions under which the freight will be moved. We also compete for business by participating in bid solicitations. Customers generally solicit bids for relatively large numbers of shipments for a period of one to two years, and typically choose to enter into contractual arrangements with a limited number of motor carriers based upon price and service.
Revenue is generated from many customers and locations primarily across the United States and North America. In 2007, our largest customer accounted for approximately 1.9% of revenue and our largest 20, 10 and 5 customers accounted for approximately 18.0%, 11.9% and 7.2% of our revenue, respectively. For each of the previous three years, over 90% of our revenue is derived from transporting LTL shipments for our customers and less than 5% of our revenue was generated from international services. We believe the diversity of our revenue base helps protect our business from adverse developments in a single geographic region and the reduction or loss of business from a single customer. For information concerning total revenue for each of the last three fiscal years, see “Management’s Discussion and Analysis of Financial Condition and Results of Operations” included in Item 7 of this report.
Competition
The transportation industry is highly competitive on the basis of both price and service. At December 31, 2007, we were the sixth largest LTL carrier in the United States, as measured by revenue. We compete with regional, inter-regional and national LTL carriers and, to a lesser extent, with truckload carriers, small package carriers, airfreight carriers and railroads. Competition is based primarily on service, price and business relationships. We believe that we are able to compete effectively in our markets by providing high quality and timely service at competitive prices.
We believe our transit times are generally faster than those of our principal national competitors. We believe this performance is due in part to our more efficient service center network, use of team drivers and investment in technology. In addition, we provide greater geographic coverage than most of our regional competitors. We believe our diversified mix and scope of regional and inter-regional services enable us to provide our customers with a single source to meet their LTL shipping needs and provides us with a distinct advantage over our regional, multi-regional and national competition.
We also believe our non-union workforce gives us a significant advantage over our unionized LTL competition. Advantages of our workforce include flexible hours and the ability of our employees to perform multiple tasks, which we believe result in greater productivity, customer service, efficiency and cost savings.
We compete with several larger transportation service providers, each of which may have more equipment, a broader coverage network and a wider range of services than we do. Our larger competitors may also have greater financial resources and, in general, the ability to reduce prices to gain business, especially during times of reduced growth rates in the economy. This could potentially limit our ability to maintain or increase prices or maintain significant growth.
Seasonality
Our tonnage levels and revenue mix are subject to seasonal trends common in the motor carrier industry. Financial results in the first quarter are normally lower due to reduced shipments during the winter months. Harsh winter weather can also adversely impact our performance by reducing demand and increasing operating expenses. Freight volumes typically build to a peak in the third quarter and early fourth quarter, which generally results in improved operating margins.
6
Technology
We continually upgrade our technological capabilities, and we provide access to our systems through multiple gateways that offer our customers maximum flexibility and immediate access to information. We employ vehicle safety systems, freight handling systems and logistics technology to reduce costs and transit times. Our principal technologies include:
| • | www.odfl.com. We continuously update our web site with current information, including service products, coverage maps, financial data, news releases, corporate governance matters, employment opportunities and other information of importance to our customers, investors and employees. Customers may also use our website to, among other things: receive rate estimates; schedule pickups; trace shipments; check transit times; and view or print shipping documents. We make available, free of charge on our web site, our Annual Report on Form 10-K, Quarterly Reports on Form 10-Q, Current Reports on Form 8-K and amendments to these reports filed or furnished pursuant to Section 13(a) of the Securities Exchange Act of 1934 as soon as reasonably practicable after we electronically file these reports with, or furnish them to, the Securities and Exchange Commission. |
| • | odfl4me.com. Customers may also manage their shipping needs from their desktops by registering on the secure area of our web site, odfl4me.com, which provides access to: enhanced shipment tracing; customizable reports; document archives; on-line cargo claims processing; interactive bills of lading; and customized rate estimates for customer-specific pricing programs. |
| • | Electronic Data Interchange (EDI). For our customers who prefer to exchange information electronically, we provide a number of EDI options with flexible formats, FTP servers and a multitude of web-service alternatives. Our customers can transmit or receive invoices, remittance advices, shipping documents, bills of lading and shipment status information, as well as other customized information. |
| • | Radio Frequency Identification (RFID) System. Our automated arrival/dispatch system monitors equipment location and freight movement throughout our system. Transponders are attached to the equipment in our fleet to enable readers to automatically record arrivals and departures, eliminating the need for manual entry and providing real-time freight tracing capabilities for our customers and employees. |
| • | Dock Yard Management (DYM) System. The DYM system records the status of shipments moving within our freight handling system through a network of handheld and fixed mounted computers on our freight docks, switching tractors and forklifts. Each barcoded shipment is monitored by these devices, which provides for real-time tracing and freight management. |
| • | Handheld Computer System. Handheld computers provide direct communication to our systems and allow our drivers to capture information during pickups and deliveries, including individual pieces and weights as well as origin and destination shipping points. Timely pickup information allows for better direct loading and efficient scheduling of linehaul operations and enhances real-time information for our customers’ visibility of their supply chain. |
| • | Pickup and Delivery Optimization System. This mapping system is utilized by our service centers to improve the efficiency of pickup and delivery (“P&D”) routes. The optimization of our P&D routes improves the efficiency of our operations, reduces costs and reduces transit times. In addition, this system enhances labor productivity by determining proper staffing and providing the most efficient freight loading patterns at our service centers. |
| • | Lane Departure Warning Systems. As part of our overall safety program, lane departure warning systems have been retrofitted on approximately one-third of our tractor fleet and are required in our specifications for all future tractor purchases. These systems consist of vehicle-mounted cameras, an onboard computer and sophisticated software that monitors the position of our vehicles in relation to highway lane markings. The system is designed to emit an audible warning signal, or “rumble strip” effect, from either side of the vehicle cabin, in the event the vehicle crosses a highway marking. |
7
Insurance
We carry a significant amount of insurance with third-party insurance carriers and we self-insure a portion of this risk. We are currently self-insured for bodily injury and property damage claims up to $2,750,000 per occurrence. Cargo loss and damage claims are self-insured up to $100,000 per occurrence. We are exposed to workers’ compensation claims up to $1,000,000 per occurrence, through either self-insurance or insurance deductibles, for the states in which we operate. Group health claims are self-insured up to $325,000 per occurrence and long-term disability claims are self-insured to a maximum per individual of $3,000 per month.
We believe that our policy of self-insuring a portion of our risk, together with our safety and loss prevention programs, is an effective means of managing insurance costs. We also believe that our current insurance coverage is adequate to cover our liability risks.
Diesel Fuel Availability and Cost
Our industry depends heavily upon the availability of diesel fuel. From time to time, we may experience shortages at certain locations and have been forced to incur additional expense to ensure adequate supply on a timely basis to prevent a disruption to our service schedules. As a result of higher diesel fuel costs, we implemented a fuel surcharge program in August 1999 that has remained in effect since that time and has become one of many components in the overall price for our transportation services. Our fuel surcharges are generally indexed to the U.S. Department of Energy’s published fuel prices that reset each week. Our management believes that our operations and financial condition are susceptible to the same diesel fuel price increases or shortages as those of our competitors. Diesel fuel costs, including fuel taxes, totaled 14.1% and 13.2% of revenue in 2007 and 2006, respectively.
Employees
As of December 31, 2007, we employed 11,573 individuals on a full-time basis in the following categories:
| Category |
Number of employees | |
| Drivers |
5,920 | |
| Platform |
2,113 | |
| Fleet technicians |
369 | |
| Sales |
459 | |
| Salaried, clerical and other |
2,712 |
As of December 31, 2007, we employed 2,815 linehaul drivers and 3,105 pickup and delivery drivers. All of our drivers are selected based upon driving records and experience. Each of our drivers is required to pass a drug test and have a current United States Department of Transportation (“DOT”) physical and a valid commercial driver’s license prior to employment. Once employed, drivers are required to obtain and maintain hazardous materials endorsements to their commercial driver’s licenses. Drivers are also required to periodically take drug and alcohol tests, by random selection.
To help fulfill driver needs, we offer qualified employees the opportunity to become drivers through the “Old Dominion Driver Training Program.” Since its inception in 1988, 2,349 individuals have graduated from this program, from which we have experienced an annual turnover rate of approximately 6%. We believe our driver training and qualification programs have been important factors in improving our safety record. Drivers with safe driving records are rewarded with bonuses of up to $1,000 annually. Driver safety bonuses paid during 2007 were $1,154,000.
Our focus on communication and the continued education, development and motivation of our employees helps to ensure that our relationship with our employees remains excellent. There are no employees represented under a collective bargaining agreement, which we believe is an important factor in our continued success.
8
Governmental Regulation
We are regulated by the Surface Transportation Board, an agency within the DOT, and by various state agencies. These regulatory authorities have broad powers, generally governing matters such as authority to engage in motor carrier operations, hours of service, certain mergers, consolidations and acquisitions, and periodic financial reporting. The trucking industry is subject to regulatory and legislative changes, such as increasingly stringent environmental and occupational safety and health regulations, limits on vehicle weight and size, ergonomics and hours of service. These changes may affect the economics of our industry by requiring changes in operating practices, increasing our cost and influencing the demand for our services.
We believe that the cost of compliance with applicable laws and regulations has not and will not materially affect our results of operations or financial condition.
Environmental Regulation
We are subject to various federal, state and local environmental laws and regulations that focus on, among other things: the emission and discharge of hazardous materials into the environment or their presence on or in our properties and vehicles; fuel storage tanks; transportation of certain materials; and the discharge or retention of storm water. Under specific environmental laws, we could also be held responsible for any costs relating to contamination at our past or present facilities and at third-party waste disposal sites. We do not believe that the cost of future compliance with environmental laws or regulations will have a material adverse effect on our operations, financial condition, competitive position or capital expenditures for the remainder of fiscal year 2008 or fiscal year 2009.
| ITEM 1A. | RISK FACTORS |
In addition to the factors discussed elsewhere in this report, the following are some of the important factors that could cause our actual results to differ materially from those projected in any forward-looking statements:
We operate in a highly competitive industry, and our business will suffer if we are unable to adequately address potential downward pricing pressures and other factors that may adversely affect our operations and profitability.
Numerous competitive factors could impair our ability to maintain our current profitability. These factors include, but are not limited to, the following:
| • | we compete with many other transportation service providers of varying sizes, some of which may have more equipment, a broader coverage network, a wider range of services, greater capital resources or have other competitive advantages; |
| • | some of our competitors periodically reduce their prices to gain business, especially during times of reduced growth rates in the economy, which may limit our ability to maintain or increase prices or maintain significant growth; |
| • | many customers reduce the number of carriers they use by selecting “core carriers” as approved transportation service providers, and in some instances we may not be selected; |
| • | many customers periodically accept bids from multiple carriers for their shipping needs, and this process may depress prices or result in the loss of some business to competitors; |
| • | the trend towards consolidation in the ground transportation industry may create other large carriers with greater financial resources and other competitive advantages relating to their size; |
| • | advances in technology require increased investments to remain competitive, and our customers may not be willing to accept higher prices to cover the cost of these investments; and |
9
| • | competition from non-asset-based logistics and freight brokerage companies may adversely affect our customer relationships and pricing policies. |
If our employees were to unionize, our operating costs would increase and our ability to compete would be impaired.
None of our employees are currently represented by a collective bargaining agreement. However, from time to time there have been efforts to organize our employees at various service centers. We can make no assurance that our employees will not unionize in the future, which could in turn have a material adverse effect on our operating results because:
| • | some shippers have indicated that they intend to limit their use of unionized trucking companies because of the threat of strikes and other work stoppages; |
| • | restrictive work rules could hamper our efforts to improve and sustain operating efficiency; |
| • | restrictive work rules could impair our service reputation and limit our ability to provide next-day services; |
| • | a strike or work stoppage would hurt our profitability and could damage customer and employee relationships; and |
| • | an election and bargaining process would distract our time and attention from our overall objectives and impose significant expenses. |
These factors, and unionization of our workforce generally, could have a material adverse effect on our business, financial condition and results of operations.
If we are unable to successfully execute our growth strategy, our business and future results of operations may suffer.
Our growth strategy includes increasing the volume of freight moving through our existing service center network, selectively expanding our geographic footprint and broadening the scope of our service offerings. In connection with our growth strategy, we have purchased additional equipment, expanded and upgraded service centers, hired additional personnel and increased our sales and marketing efforts, and expect to continue to do so. Our growth strategy exposes us to a number of risks, including the following:
| • | geographic expansion and acquisitions require start-up costs that could expose us to temporary losses; |
| • | growth and geographic expansion is dependent on the availability of real estate. Shortages of suitable real estate may limit our geographic expansion and might cause congestion in our service center network, which could result in increased operating expenses; |
| • | growth may strain our management, capital resources, information systems and customer service; |
| • | hiring new employees may increase training costs and may result in temporary inefficiencies until the employees become proficient in their jobs; |
| • | expanding our service offerings may require us to enter into new markets and encounter new competitive challenges; and |
| • | growth through acquisition could require us to temporarily match existing freight rates of the acquiree’s markets, which may be lower than the rates that we would typically charge for our services. |
We cannot assure that we will overcome the risks associated with our growth. If we fail to overcome those risks, we may not realize additional revenue or profits from our efforts, we may incur additional expenses and therefore our financial position and results of operations could be materially and adversely affected.
10
Insurance and claims expenses could significantly reduce our profitability.
We are exposed to claims related to cargo loss and damage, property damage, personal injury, workers’ compensation, long-term disability and group health. We have insurance coverage with third-party insurance carriers, but self-insure a portion of the risk associated with these claims. If the number or severity of claims for which we are self-insured increases, or we are required to accrue or pay additional amounts because the claims prove to be more severe than our original assessment, our operating results would be adversely affected. In addition, insurance companies require us to obtain letters of credit to collateralize our self-insured retention. If these requirements increase, our borrowing capacity could be adversely affected.
We may be subject to other lawsuits and claims relating to our services.
We cannot be sure that third parties will not assert claims against us with respect to existing and future services. Any litigation to determine the validity of any third party’s claims could result in significant expense and liability to us and divert the efforts of our management and other personnel, whether or not the litigation is determined in our favor or covered by insurance.
Our business is subject to general economic factors that are largely out of our control.
Economic conditions may adversely affect our customers’ business levels, the amount of transportation services they need and their ability to pay for our services. Customers encountering adverse economic conditions represent a greater potential for bad debt losses, which may require us to increase our reserve for bad debt. In addition, because we self-insure a substantial portion of our group health expense, increases in healthcare costs and pharmaceutical expenses can adversely affect our financial results. Our results also may be negatively affected by increases in interest rates, which can increase our borrowing costs and can negatively affect the level of economic activity by our customers and thus our freight volumes.
We have significant ongoing cash requirements that could limit our growth and affect our profitability if we are unable to obtain sufficient financing.
Our business is highly capital intensive. Our purchases of property and equipment in 2007 and 2006 were $186,828,000 and $199,098,000, respectively. We expect our net capital expenditures for 2008 to be approximately $155,000,000 to $165,000,000. We depend on cash flow from operations, lines of credit and senior debt to finance our tractors, trailers and service centers. If we are unable in the future to raise sufficient capital or borrow sufficient funds to make these purchases, we will be forced to limit our growth and operate our trucks for longer periods of time, which could have a material adverse effect on our operating results.
In addition, our business has significant operating cash requirements. If our cash requirements are high or our cash flow from operations is low during particular periods, we may need to seek additional financing, which may be costly or difficult to obtain. We entered into a five-year, $225,000,000 senior unsecured revolving credit facility, dated August 10, 2006, with Wachovia Bank, National Association serving as administrative agent for the lenders that we believe provides us with a sufficient source for borrowing as needed.
We may be adversely impacted by fluctuations in the price and availability of diesel fuel.
Diesel fuel is a significant operating expense. We do not hedge against the risk of diesel fuel price increases. An increase in diesel fuel prices or diesel fuel taxes, or any change in federal or state regulations that results in such an increase, could have a material adverse effect on our operating results unless the increase is offset by increases in freight rates or fuel surcharges charged to our customers. Historically, we have been able to offset significant increases in diesel fuel prices through fuel surcharges to our customers, but we cannot be certain that we will be able to do so in the future.
11
From time to time, we may experience shortages in the availability of diesel fuel at certain locations and may be forced to incur additional expense to ensure adequate supply on a timely basis to prevent a disruption to our service schedules. An interruption in the supply of diesel fuel could have a material adverse effect on our operating results.
Difficulty in attracting drivers could affect our profitability.
Competition for drivers is intense within the trucking industry, and we periodically experience difficulties in attracting and retaining qualified drivers. Our operations may be affected by a shortage of qualified drivers in the future, which could cause us to temporarily under-utilize our fleet, face difficulty in meeting shipper demands and increase our compensation levels for drivers. If we encounter difficulty in attracting or retaining qualified drivers, our ability to service our customers and increase our revenue could be adversely affected.
Limited supply and increased prices for new equipment may adversely affect our earnings and cash flow.
Investment in new equipment is a significant part of our annual capital expenditures. We may face difficulty in purchasing new equipment due to decreased supply. The price of our equipment may also be adversely affected in the future by regulations on newly manufactured tractors and diesel engines. See the risk factor below entitled: “We are subject to various environmental laws and regulations, and costs of compliance with, liabilities under, or violations of, existing or future environmental laws or regulations could adversely affect our business.”
We are subject to various environmental laws and regulations, and costs of compliance with, liabilities under, or violations of, existing or future environmental laws or regulations could adversely affect our business.
We are subject to various federal, state and local environmental laws and regulations that govern, among other things, the emission and discharge of hazardous materials into the environment, the presence of hazardous materials at our properties or in our vehicles, fuel storage tanks, the transportation of certain materials and the discharge or retention of storm water. Under certain environmental laws, we could also be held responsible for any costs relating to contamination at our past or present facilities and at third-party waste disposal sites. Environmental laws have become and are expected to continue to be increasingly more stringent over time, and there can be no assurance that our costs of complying with current or future environmental laws or liabilities arising under such laws will not have a material adverse effect on our business, operations or financial condition.
The Environmental Protection Agency has issued regulations that require progressive reductions in exhaust emissions from diesel engines through 2010. Beginning in October 2002, new diesel engines were required to meet these new emission limits. Some of the regulations required reductions in the sulfur content of diesel fuel beginning in June 2006 and the introduction of emissions after-treatment devices on newly-manufactured engines and vehicles beginning with model year 2007. Our new tractor purchases in 2008 will include engines with the after-treatment devices; however, we plan to use three different brands of these engines to evaluate which brand best meets our needs of performance and reliability. The majority of our new tractor purchases in 2007 have engines manufactured prior to 2007 without these devices, which was permitted under the regulations. These regulations have resulted in higher prices for tractors and diesel engines and increased fuel and maintenance costs. These adverse effects, combined with the uncertainty as to the reliability of the vehicles equipped with the newly designed diesel engines and the residual values that will be realized from the disposition of these vehicles, could increase our costs or otherwise adversely affect our business and operations.
We operate in a highly regulated industry, and increased costs of compliance with, or liability for violation of, existing or future regulations could have a material adverse effect on our business.
We are regulated by the DOT and by various state agencies. These regulatory authorities have broad powers, generally governing matters such as authority to engage in motor carrier operations, safety and fitness of
12
transportation equipment and drivers, driver hours of service and periodic financial reporting. In addition, the trucking industry is subject to regulatory and legislative changes from a variety of other governmental authorities, which address matters such as: (i) increasingly stringent environmental, occupational safety and health regulations and (ii) limits on vehicle weight and size. Regulatory requirements, and changes in regulatory requirements, may affect our business or the economics of the industry by requiring changes in operating practices or by influencing the demand for and the costs of providing transportation services.
Our results of operations may be affected by seasonal factors and harsh weather conditions.
Our operations are subject to seasonal trends common in the trucking industry. Our operating results in the first quarter are normally lower due to reduced demand during the winter months. Harsh weather can also adversely affect our performance by reducing demand and reducing our ability to transport freight, which could result in increased operating expenses.
If we are unable to retain our key employees, our financial condition, results of operations and cash flows could be harmed.
Our success will continue to depend upon the experience and leadership of our key employees and executive officers. In that regard, the loss of the services of any of our key personnel could have a material adverse effect on our financial condition, results of operation and cash flows.
Our principal shareholders control a large portion of our outstanding common stock.
Earl E. Congdon, John R. Congdon and members of their respective families beneficially own approximately one-third of the outstanding shares of our common stock. As long as the Congdon family controls a large portion of our voting stock, they will be able to significantly influence the election of the entire Board of Directors and the outcome of all matters involving a shareholder vote. The Congdon family’s interests may differ from other shareholders.
Our information technology systems are subject to certain risks that we cannot control.
Our information systems, including our accounting systems, are dependent upon third-party software, global communications providers, telephone systems and other aspects of technology and Internet infrastructure that are susceptible to failure. Though we have implemented redundant systems and network security measures, our information technology remains susceptible to outages, computer viruses, break-ins and similar disruptions that may inhibit our ability to provide services to our customers and the ability of our customers to access our systems. This may result in the loss of customers or a reduction in demand for our services.
| ITEM 1B. | UNRESOLVED STAFF COMMENTS |
None.
13
We own our general office located in Thomasville, North Carolina, consisting of a two-story office building of approximately 160,000 square feet on 23.6 acres of land. At December 31, 2007, we operated 192 service centers, of which 97 were owned and 95 were leased. We own all of our major breakbulk facilities, which are listed below with the number of doors as of December 31, 2007.
| Service Center |
Doors | |
| Atlanta, Georgia |
227 | |
| Rialto, California |
152 | |
| Indianapolis, Indiana |
223 | |
| Greensboro, North Carolina |
219 | |
| Harrisburg, Pennsylvania |
305 | |
| Memphis, Tennessee |
169 | |
| Morristown, Tennessee |
247 | |
| Dallas, Texas |
146 |
These facilities are strategically dispersed over the states in which we operate. At December 31, 2007, the terms of our leased properties ranged from month-to-month to a lease that expires in 2021. We believe that as current leases expire, we will be able to renew them or find comparable facilities without incurring any material negative impact on service to our customers or our operating results.
We also own thirteen non-operating properties, all of which are held for lease. Six of these properties are leased with lease terms that range from month-to-month to a lease that expires in 2011.
We believe that all of our properties are in good repair and are capable of providing the level of service required by current business levels and customer demands.
We are involved in various legal proceedings and claims that have arisen in the ordinary course of our business that have not been fully adjudicated. Many of these are covered in whole or in part by insurance. Our management does not believe that these actions, when finally concluded and determined, will have a material adverse effect upon our financial position or results of operations.
On July 30, 2007, the Company was named in a putative class action complaint against us and 10 other major LTL motor carriers and large transportation companies offering LTL services (together, the “Defendants”). This complaint alleges that the Defendants conspired to restrain trade in violation of Section 1 of the Sherman Act in connection with fuel surcharges to customers, and seeks injunctive relief, treble damages and attorneys’ fees. Subsequent to this original complaint, similar complaints have been filed against the Defendants and other LTL motor carriers, each with the same allegation of conspiracy to fix fuel surcharge rates. On December 20, 2007, these cases were consolidated in the United States District Court for the Northern District of Georgia and are now in the process of being transferred to that court. Due to the nature and status of these claims, we cannot determine the likelihood of an adverse outcome nor an amount or reasonable range of potential loss, if any, in these matters. We believe that these allegations have no merit and intend to vigorously defend ourselves.
ITEM 4. SUBMISSION OF MATTERS TO A VOTE OF SECURITY HOLDERS
None.
14
| ITEM 5. | MARKET FOR THE REGISTRANT’S COMMON EQUITY, RELATED STOCKHOLDER MATTERS AND ISSUER PURCHASES OF EQUITY SECURITIES |
Common Stock and Dividend Information
Our common stock is traded on the NASDAQ Global Select Market under the symbol ODFL. At February 25, 2008, there were approximately 9,400 holders of our common stock, including 148 shareholders of record. We did not pay any dividends on our common stock during fiscal year 2007 or 2006, and we have no current plans to declare or pay any dividends on our common stock during fiscal year 2008. For information concerning restrictions on our ability to make dividend payments, see “Management’s Discussion and Analysis of Financial Condition and Results of Operations – Liquidity and Capital Resources” included in Item 7 of this report and Note 3 of the Notes to the Financial Statements included in Item 8 of this report.
The following table sets forth the high and low sales price of our common stock for the periods indicated, as reported by the NASDAQ Global Select Market:
| 2007 | ||||||||||||
| First Quarter |
Second Quarter |
Third Quarter |
Fourth Quarter | |||||||||
| High |
$ | 33.78 | $ | 33.65 | $ | 32.57 | $ | 25.65 | ||||
| Low |
$ | 24.45 | $ | 27.67 | $ | 23.82 | $ | 20.41 | ||||
| 2006 | ||||||||||||
| First Quarter |
Second Quarter |
Third Quarter |
Fourth Quarter | |||||||||
| High |
$ | 29.04 | $ | 38.59 | $ | 39.50 | $ | 34.03 | ||||
| Low |
$ | 24.62 | $ | 25.54 | $ | 29.20 | $ | 24.04 | ||||
15
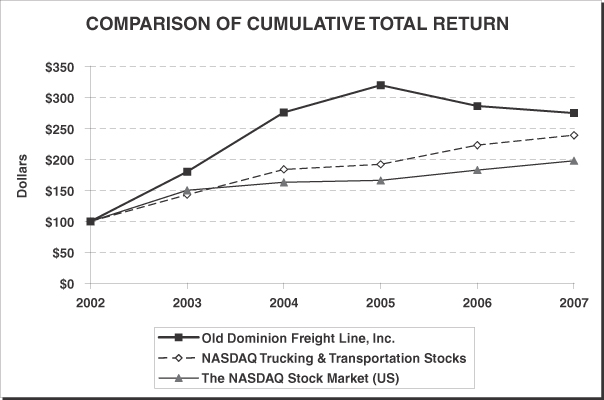
Performance Graph
The following graph compares the total shareholder cumulative returns, assuming the reinvestment of all dividends, of $100 invested on December 31, 2002, in (i) our Common Stock, (ii) the NASDAQ Trucking & Transportation Stocks and (iii) The NASDAQ Stock Market (US) for the five-year period ended December 31, 2007:
Cumulative Total Return
| 12/31/02 | 12/31/03 | 12/31/04 | 12/31/05 | 12/31/06 | 12/31/07 | |||||||||||||
| Old Dominion Freight Line, Inc |
$ | 100 | $ | 180 | $ | 276 | $ | 320 | $ | 286 | $ | 275 | ||||||
| NASDAQ Trucking and Transportation Stocks |
$ | 100 | $ | 143 | $ | 184 | $ | 192 | $ | 223 | $ | 239 | ||||||
| The NASDAQ Stock Market (US) |
$ | 100 | $ | 150 | $ | 163 | $ | 166 | $ | 183 | $ | 198 | ||||||
16
ITEM 6. SELECTED FINANCIAL DATA
SELECTED FINANCIAL DATA
| For the Year Ended December 31, | ||||||||||||||||||||
| (In thousands, except per share amounts and operating statistics) |
2007 | 2006 | 2005 | 2004 | 2003 | |||||||||||||||
| Operating Data: |
||||||||||||||||||||
| Revenue from operations |
$ | 1,401,542 | $ | 1,279,431 | $ | 1,061,403 | $ | 824,051 | $ | 667,531 | ||||||||||
| Operating expenses: |
||||||||||||||||||||
| Salaries, wages and benefits |
751,371 | 682,886 | 585,879 | 468,775 | 396,521 | |||||||||||||||
| Operating supplies and expenses |
238,879 | 204,386 | 158,029 | 100,660 | 72,084 | |||||||||||||||
| General supplies and expenses |
40,075 | 37,507 | 31,940 | 27,630 | 23,222 | |||||||||||||||
| Operating taxes and licenses |
50,874 | 46,693 | 38,961 | 31,286 | 26,627 | |||||||||||||||
| Insurance and claims |
33,347 | 33,080 | 28,143 | 26,095 | 17,583 | |||||||||||||||
| Communications and utilities |
15,023 | 14,278 | 12,573 | 11,361 | 10,280 | |||||||||||||||
| Depreciation and amortization |
79,863 | 67,634 | 55,897 | 44,823 | 38,210 | |||||||||||||||
| Purchased transportation |
43,889 | 43,933 | 35,005 | 29,443 | 21,389 | |||||||||||||||
| Building and office equipment rents |
11,910 | 11,143 | 9,490 | 7,531 | 7,403 | |||||||||||||||
| Miscellaneous expenses, net |
6,374 | 7,406 | 7,901 | 5,839 | 2,996 | |||||||||||||||
| Total operating expenses |
1,271,605 | 1,148,946 | 963,818 | 753,443 | 616,315 | |||||||||||||||
| Operating income |
129,937 | 130,485 | 97,585 | 70,608 | 51,216 | |||||||||||||||
| Interest expense, net * |
12,960 | 10,206 | 6,527 | 5,273 | 6,111 | |||||||||||||||
| Other expense (income), net |
1,182 | 936 | 787 | 748 | (192 | ) | ||||||||||||||
| Income before income taxes and cumulative effect of accounting change |
115,795 | 119,343 | 90,271 | 64,587 | 45,297 | |||||||||||||||
| Provision for income taxes |
43,963 | 46,774 | 36,388 | 25,595 | 17,697 | |||||||||||||||
| Income before cumulative effect of accounting change |
71,832 | 72,569 | 53,883 | 38,992 | 27,600 | |||||||||||||||
| Cumulative effect of accounting change, net |
— | — | 408 | — | — | |||||||||||||||
| Net income |
$ | 71,832 | $ | 72,569 | $ | 53,475 | $ | 38,992 | $ | 27,600 | ||||||||||
| Per Share Data: |
||||||||||||||||||||
| Diluted earnings per share before cumulative effect of accounting change |
$ | 1.93 | $ | 1.95 | $ | 1.45 | $ | 1.06 | $ | 0.76 | ||||||||||
| Diluted earnings per share |
$ | 1.93 | $ | 1.95 | $ | 1.43 | $ | 1.06 | $ | 0.76 | ||||||||||
| Operating Statistics: |
||||||||||||||||||||
| Operating ratio |
90.7 | % | 89.8 | % | 90.8 | % | 91.4 | % | 92.3 | % | ||||||||||
| Revenue per hundredweight |
$ | 13.30 | $ | 13.16 | $ | 12.63 | $ | 11.61 | $ | 11.00 | ||||||||||
| Revenue per intercity mile |
$ | 4.31 | $ | 4.32 | $ | 4.12 | $ | 3.76 | $ | 3.53 | ||||||||||
| Intercity miles (in thousands) |
325,268 | 296,464 | 257,900 | 219,201 | 189,084 | |||||||||||||||
| Total tons (in thousands) |
5,271 | 4,859 | 4,203 | 3,550 | 3,040 | |||||||||||||||
| Total shipments (in thousands) |
6,765 | 6,428 | 5,751 | 4,918 | 4,366 | |||||||||||||||
| Average length of haul (miles) |
935 | 934 | 926 | 937 | 926 | |||||||||||||||
| As of December 31, | ||||||||||||||||||||
| 2007 | 2006 | 2005 | 2004 | 2003 | ||||||||||||||||
| Balance Sheet Data: |
||||||||||||||||||||
| Current assets |
$ | 216,277 | $ | 256,367 | $ | 150,213 | $ | 122,537 | $ | 97,055 | ||||||||||
| Current liabilities |
127,723 | 121,546 | 111,028 | 93,820 | 74,017 | |||||||||||||||
| Total assets |
981,048 | 892,193 | 641,648 | 504,733 | 430,244 | |||||||||||||||
| Long-term debt (including current maturities) |
263,754 | 274,582 | 128,956 | 79,454 | 97,426 | |||||||||||||||
| Shareholders’ equity |
489,452 | 417,620 | 345,051 | 291,528 | 232,541 | |||||||||||||||
| * | For the purpose of this table, interest expense is presented net of interest income. |
17
ITEM 7. MANAGEMENT’S DISCUSSION AND ANALYSIS OF FINANCIAL CONDITION AND RESULTS OF OPERATIONS
Overview
We are a leading non-union national less-than-truckload (“LTL”) motor carrier providing multi-regional service among six regions in the United States and next-day and second-day service within these regions. Historically, over 90% of our revenue is derived from transporting LTL shipments for our customers, whose demand for our services is generally tied to the overall health of the U.S. domestic economy.
In analyzing the components of our revenue, we monitor changes and trends in the following key metrics:
| • | Revenue Per Hundredweight – This measurement reflects our pricing policies, which are influenced by competitive market conditions and our growth objectives. Generally, freight is rated by a class system, which is established by the National Motor Freight Traffic Association, Inc. Light, bulky freight typically has a higher class and is priced at higher revenue per hundredweight than dense, heavy freight. Changes in the class, packaging of the freight and length of haul of the shipment can also affect this average. Fuel surcharges, accessorial charges and revenue adjustments, excluding adjustments for undelivered freight, are included in this measurement for all periods presented in this report. Although we are required to record revenue adjustments for undelivered freight for financial statement purposes in accordance with our revenue recognition policy, we believe excluding them from our revenue per hundredweight measurement results in a better indicator of changes in our pricing. |
| • | Weight Per Shipment – Fluctuations in weight per shipment can indicate changes in the class, or mix, of freight we receive from our customers as well as changes in the number of units included in a shipment. Generally, increases in weight per shipment indicate higher demand for our customers’ products and overall increased economic activity. |
| • | Average Length of Haul – We consider lengths of haul less than 500 miles to be regional traffic, lengths of haul between 500 miles and 1,000 miles to be inter-regional traffic, and lengths of haul in excess of 1,000 miles to be national traffic. By segmenting our revenue into lengths of haul, we can determine our market share and the growth potential of our service products in those markets. |
| • | Revenue Per Shipment – This measurement is primarily determined by the three metrics listed above and is used, in conjunction with the number of shipments we receive, to calculate total revenue, excluding adjustments for undelivered freight. |
Our primary revenue focus is to increase shipment and tonnage growth within our existing infrastructure, generally referred to as increasing density, thereby maximizing asset utilization and labor productivity. We measure density over many different functional areas of our operations including revenue per service center, linehaul load factor, P&D stops per hour and P&D shipments per hour. We believe continued improvement in density and a focus on individual account profitability are key components in our ability to sustain profitable growth.
Our primary cost elements are direct wages and benefits associated with the movement of freight; operating supplies and expenses; and depreciation of our equipment fleet and service center facilities. We gauge our overall success in managing these costs by monitoring our operating ratio, a measure of profitability calculated by dividing total operating expenses by revenue, which also allows industry-wide comparisons with our competition.
We continually upgrade our technological capabilities to improve our customer service and lower our operating costs. This technology provides our customers with visibility of their shipments throughout our systems, increases the productivity of our workforce and provides key metrics from which we can monitor our processes.
18
Results of Operations
The following table sets forth, for the years indicated, expenses and other items as a percentage of revenue from operations:
| 2007 | 2006 | 2005 | |||||||
| Revenue from operations |
100.0 | % | 100.0 | % | 100.0 | % | |||
| Salaries, wages and benefits |
53.6 | 53.4 | 55.2 | ||||||
| Operating supplies and expenses |
17.0 | 16.0 | 14.9 | ||||||
| General supplies and expenses |
2.9 | 2.9 | 3.0 | ||||||
| Operating taxes and licenses |
3.6 | 3.6 | 3.7 | ||||||
| Insurance and claims |
2.4 | 2.6 | 2.6 | ||||||
| Communication and utilities |
1.1 | 1.1 | 1.2 | ||||||
| Depreciation and amortization |
5.7 | 5.3 | 5.3 | ||||||
| Purchased transportation |
3.1 | 3.4 | 3.3 | ||||||
| Building and office equipment rents |
0.8 | 0.9 | 0.9 | ||||||
| Miscellaneous expenses, net |
0.5 | 0.6 | 0.7 | ||||||
| Total operating expenses |
90.7 | 89.8 | 90.8 | ||||||
| Operating income |
9.3 | 10.2 | 9.2 | ||||||
| Interest expense, net * |
0.9 | 0.8 | 0.6 | ||||||
| Other expense, net |
0.1 | 0.1 | 0.1 | ||||||
| Income before income taxes and cumulative effect of accounting change |
8.3 | 9.3 | 8.5 | ||||||
| Provision for income taxes |
3.2 | 3.6 | 3.4 | ||||||
| Income before cumulative effect of accounting change |
5.1 | % | 5.7 | % | 5.1 | % | |||
| * | For the purpose of this table, interest expense is presented net of interest income. |
2007 Compared to 2006
Key financial and operating metrics for 2007 and 2006 are presented below:
| 2007 | 2006 | Change | % Change | ||||||||||||
| Revenue (in thousands) |
$ | 1,401,542 | $ | 1,279,431 | $ | 122,111 | 9.5 | % | |||||||
| Operating ratio |
90.7 | % | 89.8 | % | 0.9 | % | 1.0 | % | |||||||
| Net income (in thousands) |
$ | 71,832 | $ | 72,569 | $ | (737 | ) | (1.0 | )% | ||||||
| Diluted earnings per share |
$ | 1.93 | $ | 1.95 | $ | (0.02 | ) | (1.0 | )% | ||||||
| Tonnage (in thousands) |
5,271 | 4,859 | 412 | 8.5 | % | ||||||||||
| Shipments (in thousands) |
6,765 | 6,428 | 337 | 5.2 | % | ||||||||||
| Revenue per hundredweight |
$ | 13.30 | $ | 13.16 | $ | 0.14 | 1.1 | % | |||||||
| Weight per shipment (lbs.) |
1,558 | 1,512 | 46 | 3.0 | % | ||||||||||
| Average length of haul (miles) |
935 | 934 | 1 | 0.1 | % | ||||||||||
| Revenue per shipment |
$ | 207.24 | $ | 199.03 | $ | 8.21 | 4.1 | % | |||||||
Our 2007 financial results are reflective of a difficult operating environment that became increasingly competitive in terms of pricing throughout the year. Despite the general weakness in the domestic economy and resulting competitive pricing environment, we were able to increase revenue by 9.5% to $1,401,542,000 in 2007 and increase our total tonnage shipped by 8.5%. These accomplishments are the result of the consistent execution of our business strategies in the LTL marketplace, which has resulted in increased market share. We also maintained our revenue focus on increasing density, which resulted in producing over 95% of our revenue from service centers open for more than one year and an overall increase in average revenue per service center of 2.5%. Despite our growth in revenue and tonnage during the year, we were unable to increase our pricing sufficiently to overcome increased operating costs, particularly with respect to the increased cost of diesel fuel.
19
As a result, net income decreased 1.0% to $71,832,000 in 2007 and our operating ratio increased to 90.7% from 89.8% in 2006. Nevertheless, our slightly higher operating ratio in 2007 is the second best we have achieved since becoming a public company in 1991 and reflects our continued focus on managing costs during a period of slower growth and continued gains in efficiency throughout our operations.
Our revenue growth in 2007 was the result of a 5.2% growth in shipments and a 4.1% increase in revenue per shipment. The increase in revenue per shipment consists of increases in both weight per shipment and revenue per hundredweight of 3.0% and 1.1%, respectively, from 2006. Our tonnage increased 8.5% over 2006 from the combination of increases in shipments and weight per shipment. We believe our growth is attributable to our ability to offer a one-source solution for shippers’ regional and inter-regional needs by providing these services through one company, in contrast to many of our principal competitors. Additionally, the expansion of our geographic footprint, as well as increased full-state coverage, has positioned us to become a better shipping alternative for more and more shippers. The increase in weight per shipment in 2007, despite the current economic environment, is indicative of our success in gaining market share with larger national shippers.
While most of our revenue growth is derived from service centers open for more than one year, the expansion of our service center network and improvement in our service capabilities should provide a platform for future growth. We increased the total number of service centers in our network to 192 at December 31, 2007 from 182 at December 31, 2006. Revenue growth from geographic expansion typically results in additional freight moving through our existing service center network, which helps to offset lower profit margins that typically accompany new service center openings.
Revenue per hundredweight increased 1.1% to $13.30 from $13.16 in 2006 and includes the impact of the general rate increase on our base rates and minimum charges for certain tariffs we implemented on March 26, 2007. Our revenue per hundredweight in 2007 was negatively impacted by a competitive pricing environment that progressively worsened in the second half of the year and an increase in weight per shipment. As a result of a general slowdown in the domestic economy and a reduction in freight shipped, many carriers in our industry reduced their prices to increase or maintain tonnage and shipment volumes. While we increased the volume of freight moving through our service center network, we followed our basic pricing philosophy of evaluating each individual account for profitability in an effort to maintain rational pricing for our services. We implemented a general rate increase effective February 11, 2008 and plan to maintain our disciplined pricing approach in 2008; however, a prolonged slowdown in the domestic economy or recession may lead to additional pressure on our pricing metrics and negatively impact our net income and margins.
Fuel surcharge revenue increased to 12.4% of revenue from 11.9% in 2006. Our tariffs and contracts generally provide for a fuel surcharge as diesel fuel prices increase above stated levels, which are generally indexed to the U.S. Department of Energy’s published fuel prices that reset each week. This surcharge is recorded as additional revenue and was implemented to offset significant fluctuations in the price of diesel fuel, which is one of the larger components of our operating supplies and expenses. Because of the sustained increase in diesel fuel costs and other petroleum-based products, our freight pricing strategy, as well as that in the LTL industry, has evolved such that the fuel surcharge is one of many components in the overall price for our transportation services. We continuously monitor the components of our pricing, including fuel surcharges, to minimize any negative impact to our profitability that would likely result from a rapid and significant change in diesel fuel prices.
Salaries, wages and benefits increased to 53.6% of revenue in 2007 from 53.4% in 2006. Driver wages increased to 22.1% of revenue from 21.7% in 2006 and employee benefit costs increased to 11.9% of revenue from 11.5% in 2006, primarily due to higher group health costs and increased costs for our employee paid time off plans. These increases were partially offset by decreased wages for salaried and clerical employees, primarily due to a reduction in bonuses. Bonus payments are generally based on multiple factors including growth in revenue, on-time service and/or income before taxes. Our revenue increased 9.5% in 2007 as compared to 20.5% in 2006 and net income decreased slightly.
20
While our driver wages increased as a percent of revenue, we were able to utilize our own equipment and labor to decrease our reliance on purchased transportation services from other motor carriers and railroads to 3.1% of revenue from 3.4% in 2006. These services are primarily utilized when there are capacity restraints or imbalances in freight flow within our service center network or when it is economically beneficial. In addition to the increased use of our workforce for linehaul services, we provided annual pay increases to our driver workforce in September 2006 and 2007, which we seek to recover through increases in the pricing for our services and productivity improvements in our linehaul and P&D operations. We realized productivity improvements in 2007, as our linehaul load factor improved 2.0%, P&D stops per hour improved 2.8% and P&D shipments per hour improved 2.4%. Our P&D operations continue to benefit from the additional density caused by growth in tonnage, the efficiencies in our route planning through the use of our P&D route optimization software and the use of our driver handheld computers. Despite these productivity gains, our price increases were not sufficient in overcoming our wage increases and the decrease in purchased transportation.
Operating supplies and expenses increased to 17.0% of revenue in 2007 from 16.0% in 2006. This increase is primarily due to an increase in diesel fuel costs, excluding fuel taxes, which increased to 11.5% of revenue from 10.7% in 2006. The increase in these costs is a result of a 7.4% increase in the average price per gallon of diesel fuel and an 8.8% increase in consumption. The consumption increase also resulted in an increase in our fuel taxes, which primarily accounts for the change in our “operating taxes and licenses”. We currently do not use diesel fuel hedging instruments and are thus subject to market price fluctuations.
We made significant investments in revenue equipment and real estate in 2007 to increase the capacity of our fleet and support our planned growth in shipments. As a result of these investments, as well as lower shipment growth than originally forecasted for 2007, depreciation and amortization increased to 5.7% of revenue in 2007 from 5.3% in 2006.
Interest expense, net of interest income, increased to $12,960,000 for 2007 from $10,206,000 for 2006. This increase is primarily due to an increased average balance outstanding on our long-term debt resulting from the two separate issuances of privately-placed senior notes under the Note Purchase Agreement entered into on April 25, 2006. In addition, interest income decreased $731,000 in 2007 due to a decline in the average balance of cash equivalents and short-term investments. The effective average tax-equivalent yield, excluding state-tax benefits, on our short-term investments was 6.32% and 5.68% for 2007 and 2006, respectively.
Our effective tax rate for 2007 was 38.0% compared to 39.2% in 2006. The decrease in our effective tax rate is due primarily to the impact of alternative fuel tax credits for the use of propane in our operations that we became eligible for in 2007 and, to a lesser extent, the resolution of various state tax matters in the first quarter of 2007 that decreased our liability for unrecognized tax benefits. The alternative fuel tax credits expire in September 2009 and, therefore, we expect will continue to favorably impact our effective tax rate until expiration. Our effective tax rate exceeded the federal statutory rate of 35% primarily due to the impact of state taxes and certain non-deductible items.
21
2006 Compared to 2005
Key financial and operating metrics for 2006 and 2005 are presented below:
| 2006 | 2005 | Change | % Change | ||||||||||||
| Revenue (in thousands) |
$ | 1,279,431 | $ | 1,061,403 | $ | 218,028 | 20.5 | % | |||||||
| Operating ratio |
89.8 | % | 90.8 | % | (1.0 | )% | (1.1 | )% | |||||||
| Net income (in thousands) |
$ | 72,569 | $ | 53,475 | $ | 19,094 | 35.7 | % | |||||||
| Diluted earnings per share |
$ | 1.95 | $ | 1.43 | $ | 0.52 | 36.4 | % | |||||||
| Tonnage (in thousands) |
4,859 | 4,203 | 656 | 15.6 | % | ||||||||||
| Shipments (in thousands) |
6,428 | 5,751 | 677 | 11.8 | % | ||||||||||
| Revenue per hundredweight |
$ | 13.16 | $ | 12.63 | $ | 0.53 | 4.2 | % | |||||||
| Weight per shipment (lbs.) |
1,512 | 1,462 | 50 | 3.4 | % | ||||||||||
| Average length of haul (miles) |
934 | 926 | 8 | 0.9 | % | ||||||||||
| Revenue per shipment |
$ | 199.03 | $ | 184.61 | $ | 14.42 | 7.8 | % | |||||||
In 2006 and for the third consecutive year, we produced revenue growth in excess of 20% and growth in diluted earnings per share in excess of 30%. We maintained our revenue focus on increasing density, which resulted in producing over 90% of our revenue from service centers open for more than one year and a 3.7% increase in average revenue per service center. The operating leverage we generated resulted in continued improvement in our operating ratio to 89.8%, which was the first time we operated below 90.0% as a public company and was our fifth consecutive year of improvement.
Our revenue growth in 2006 was the result of an 11.8% growth in shipments and a 7.8% increase in revenue per shipment. The increase in revenue per shipment consists of increases in both revenue per hundredweight and weight per shipment of 4.2% and 3.4%, respectively, from 2005. The combination of increases in shipments and weight per shipment produced 15.6% tonnage growth over 2005. We believe our growth, particularly in existing markets, is attributable to our ability to offer a one-source solution for shippers’ regional and inter-regional needs by providing these services through one company, in contrast to many of our principal competitors. Additionally, the expansion of our geographic footprint, as well as increased full-state coverage, has positioned us to be attractive to more and more shippers.
While most of our revenue growth is derived from service centers open for more than one year, the expansion of our service center network and improvement in our service capabilities should provide a platform for future growth. We increased the total number of service centers in our network to 182 at December 31, 2006 from 154 at December 31, 2005. Revenue growth from geographic expansion typically results in additional freight moving through our existing service center network, which helps to offset higher operating margins that typically accompany new service center openings. Seven of the service centers opened in 2006 were spin-offs of existing service centers to improve service and create additional capacity for growth. Due to the established customer base and operating presence in those markets, we were able to operate those spin-offs profitably within a shorter period of time than traditional openings in new geographic territories.
Revenue per hundredweight increased 4.2% to $13.16 from $12.63 in 2005. This pricing improvement reflected the general rate increase on our base rates and minimum charges for certain tariffs, effective April 17, 2006, and occurred despite the increase in weight per shipment, which generally has the effect of reducing revenue per hundredweight. This pricing improvement demonstrated a stable economy and pricing environment throughout most of 2006 and our ability to maintain pricing discipline while increasing the volume of freight moving through our service center network. We experienced a decline in the fourth quarter of 2006 in weight per shipment and a slowdown in our tonnage growth, which are consistent with market indicators of a slowing economy and the reported results of others in our industry. If these trends continue, pricing pressures could become more prevalent in the marketplace and our growth in revenue and net income could slow in comparison to the historical annual growth rates.
22
Our tariffs and contracts generally provide for a fuel surcharge as diesel fuel prices increase above stated levels, which are generally indexed to the U.S. Department of Energy’s published fuel prices that reset each week. This surcharge is recorded as additional revenue and was implemented to offset significant fluctuations in the price of diesel fuel, which is one of the larger components of our operating supplies and expenses. Because of the sustained increase in diesel fuel costs and other petroleum-based products, our freight pricing strategy, as well as that in the LTL industry, has evolved such that the fuel surcharge is one of many components in the overall price for our transportation services. Because of average higher diesel fuel prices in 2006 and the evolution of our freight pricing strategy, the fuel surcharge increased to 11.9% of revenue in 2006 from 10.3% in 2005.
Much of the overall improvement in our operating ratio was achieved by the improvement in salaries, wages and benefits as a percent of revenue, which decreased to 53.4% of revenue in 2006 from 55.2% of revenue in 2005. This improvement primarily resulted from a decrease in benefit costs to 11.5% of revenue in 2006 from 12.4% in 2005. Workers compensation expenses decreased 1.2%, as a percent of revenue, from 2005, as a result of favorable claims experience and a favorable adjustment to our reserve for unpaid claims following the results of an annual third-party analysis of this reserve in the fourth quarter of 2006. These improvements were somewhat offset by a 0.3% increase, as a percent of revenue, in benefit costs resulting from enhancements to our vacation policy and additional costs to provide group health benefits to our employees.
In addition to the improvement in benefit costs, our salary and clerical wages decreased by 0.4% of revenue from 2005 as we leveraged our revenue growth over this segment of our workforce. P&D driver wages decreased by 0.2% of revenue from 2005, which can be attributed to a 2.9% improvement in our P&D stops per hour. We benefited from the additional density caused by growth in tonnage, the efficiencies in our route planning through the use of our P&D route optimization software and the use of our driver handheld computers. Platform wages also decreased by 0.2% of revenue from 2005, primarily due to a 6.3% increase in platform pounds handled per hour.
Operating supplies and expenses increased to 16.0% of revenue in 2006 from 14.9% in 2005. This increase was primarily due to a 35.2% increase in diesel fuel costs, excluding fuel taxes, resulting from increased diesel fuel prices and a 16.5% increase in consumption. The consumption increase resulted in an increase in our fuel taxes, which primarily accounts for the change in our “operating taxes and licenses”. We currently do not use diesel fuel hedging instruments; therefore, we are subject to market price fluctuations.
We made significant investments in revenue equipment and real estate in 2005 and 2006 to support our growth and to prevent our fleet and service center network from becoming a limiting factor to our growth. As a result, depreciation and amortization remained consistent at 5.3% of revenue in 2006 and 2005. In addition, building and office equipment rents also remained consistent at 0.9% of revenue in 2006 and 2005.
We purchase transportation services from other motor carriers and railroads for linehaul and P&D services. We also contract with lease operators for our container operations and incur short-term rentals for tractors, trailers and other revenue-producing equipment. We primarily utilize these services when there are capacity restraints or imbalances of freight flow within our service center network or when it is economically beneficial. Purchased transportation increased slightly to 3.4% of revenue in 2006 from 3.3% in 2005. The increase is primarily due to the increased use of purchased linehaul services beginning in the second quarter of 2006, which became necessary in certain lanes because of our significant growth. We were able to add a sufficient number of drivers in the third quarter of 2006, which allowed us to utilize our own equipment and decrease the use of purchased linehaul services. As a result, purchased linehaul services have returned to historical levels and represent an opportunity for additional operating leverage that may be obtained with the continued expansion of our network.
Interest expense, net of interest income, increased to $10,206,000 for 2006 from $6,527,000 for 2005. This increase is primarily due to an increased average balance outstanding on our long-term debt resulting from the two separate issuances of privately-placed senior notes under the Note Purchase Agreement entered into on
23
April 25, 2006, offset by the $2,237,000 of interest income earned on cash equivalents and short-term investments. The effective average tax-equivalent yield, excluding the state-tax benefit, on our short-term investments was 5.68% for 2006.
Our effective tax rate for 2006 was 39.2% compared to 40.3% in 2005. The decrease in our effective tax rate is due primarily to the tax-exempt interest income earned on our cash equivalents and short-term investments in 2006. Our effective tax rate exceeds the federal statutory rate of 35% primarily due to the impact of state taxes and, to a lesser extent, certain non-deductible items.
Liquidity and Capital Resources
We have three primary sources of available liquidity to fund our estimated capital expenditures: cash flows from operations, short-term investments and available borrowings under the senior unsecured revolving credit agreement dated August 10, 2006. We also have the ability to issue senior notes to provide another source of liquidity, if needed. Expansion in both the size and number of service center facilities, our planned tractor and trailer replacement cycle and revenue growth have required continued investment in real estate and equipment. In order to support these requirements in 2007, we purchased property and equipment of $186,828,000 and paid $20,431,000 to acquire certain business assets from Priority Freight Lines, Inc. and Bullocks Express Transportation, Inc. Cash flows from operations and proceeds from the sale of property and equipment funded approximately 79% of these expenditures. At December 31, 2007, short-term investments decreased to $24,375,000 from $85,160,000 at December 31, 2006. We utilized net proceeds of $60,785,000 from the sale of investment securities during 2007 in part for the capital expenditures not funded by cash flows from operations.
We currently project capital expenditures, net of anticipated proceeds from dispositions, to be approximately $155,000,000 to $165,000,000 for the year ending December 31, 2008. Of our capital expenditures, approximately $100,000,000 is allocated for the purchase of service center facilities, construction of new service center facilities or expansion of existing service center facilities; approximately $40,000,000 is allocated for the purchase of tractors and trailers; and approximately $10,000,000 is allocated for investments in technology. We estimate that our capital expenditures in 2008 for revenue equipment will be lower than 2007 as we believe the current capacity of our fleet can meet our anticipated growth in 2008 and expenditures should be primarily limited to replacement equipment. We plan to fund these capital expenditures primarily through cash flows from operations and the liquidation of our short-term investments. For information concerning the risks related to our short-term investments, see “Quantitative and Qualitative Disclosures about Market Risk” included in Item 7A of this report.
The table below sets forth our net capital expenditures for property and equipment, including those obtained through acquisition of business assets and capital leases, for the years ended December 31, 2007, 2006 and 2005:
| Year Ended December 31, | ||||||||||||
| (In thousands) |
2007 | 2006 | 2005 | |||||||||
| Land and structures |
$ | 72,286 | $ | 82,011 | $ | 33,157 | ||||||
| Tractors |
52,807 | 59,759 | 50,457 | |||||||||
| Trailers |
43,793 | 49,209 | 52,949 | |||||||||
| Technology |
9,582 | 10,265 | 9,518 | |||||||||
| Other |
21,955 | 12,878 | 9,710 | |||||||||
| Proceeds from sale |
(5,228 | ) | (5,626 | ) | (5,221 | ) | ||||||
| Total |
$ | 195,195 | $ | 208,496 | $ | 150,570 | ||||||
We entered into a five-year, $225,000,000 senior unsecured revolving credit facility pursuant to the terms of an amended and restated credit agreement (the “Credit Agreement”), dated August 10, 2006, with Wachovia Bank, National Association serving as administrative agent for the lenders. Of the $225,000,000 line of credit commitments, $150,000,000 may be used for letters of credit and $15,000,000 may be used for borrowings under Wachovia’s sweep program. The sweep program is a daily cash management tool that automatically initiates
24
borrowings to cover overnight cash requirements up to an aggregate of $15,000,000 or initiates overnight investments for excess cash balances. In addition, we have the right to request an increase in the line of credit commitments up to a total of $300,000,000 in minimum increments of $25,000,000. At our option, revolving loans under the facility bear interest at either: (a) the higher of Wachovia Bank’s prime rate or the federal funds rate plus 0.5% per annum (the “Base Rate”); (b) LIBOR (one, two, three or six months) plus an applicable margin (the “Adjusted LIBOR Rate”); or (c) one-month LIBOR plus an applicable margin (the “LIBOR Index Rate”). The applicable margin is determined by a pricing grid in the Credit Agreement and ranges from 0.5% to 1.125%. The applicable margin for the Credit Agreement in 2007 was 0.625%. Revolving loans under the sweep program bear interest at the LIBOR Index Rate.
The Credit Agreement contains customary covenants, including financial covenants that require us to observe a maximum ratio of debt to total capital and a minimum fixed charge coverage ratio. Any future wholly owned subsidiaries of the Company would be required to guarantee payment of all of our obligations under the facility. At December 31, 2007, there was no outstanding balance on the line of credit facility and there was $51,717,000 of outstanding letters of credit.
Commitment fees ranging from 0.1% to 0.225% are charged quarterly in arrears on the aggregate unutilized portion of the Credit Agreement. Letter of credit fees equal to the applicable margin for Adjusted LIBOR Rate loans are charged quarterly in arrears on the daily average aggregate stated amount of all letters of credit outstanding during the quarter. The commitment fees and letter of credit fees were 0.125% and 0.625%, respectively, for the Credit Agreement in 2007. In addition, a facing fee at an annual rate of 0.125% is charged quarterly in arrears on the daily average aggregate stated amount of all letters of credit outstanding during such quarter.
We have four unsecured senior note agreements outstanding totaling $261,500,000 at December 31, 2007. These notes call for periodic principal payments with maturities ranging from 2008 to 2016, of which $11,500,000 is due in the next twelve months. Interest rates on these notes are fixed and range from 4.68% to 6.93%. The effective average interest rate on our outstanding senior note agreements was 5.56% and 5.62% at December 31, 2007 and 2006, respectively.
With the exception of borrowings pursuant to the Credit Agreement, if any, interest rates are fixed on all of our debt instruments. Therefore, short-term exposure to fluctuations in interest rates is limited to our line of credit facility. We do not currently use interest rate derivative instruments to manage exposure to interest rate changes. Also, we do not use fuel hedging instruments, as our tariff provisions and contracts generally allow for fuel surcharges to be implemented in the event that fuel prices exceed stipulated levels.
Our senior notes and Credit Agreement limit the amount of dividends that may be paid to shareholders pursuant to certain financial ratios. Our Credit Agreement, which was the most restrictive at December 31, 2007, limits the amount of dividends that could be paid to shareholders to the greater of (i) $10,000,000, (ii) the amount of dividends paid in the immediately preceding fiscal year, or (iii) an amount equal to 25% of net income from the immediately preceding fiscal year. We did not declare or pay a dividend on our common stock in 2007 or 2006.
A significant decrease in demand for our services could limit our ability to generate cash flow and affect profitability. Most of our debt agreements have covenants that require stated levels of financial performance, which if not achieved could cause acceleration of the payment schedules. We do not anticipate a significant decline in business levels or financial performance, and we believe the combination of our existing Credit Agreement along with our additional borrowing capacity will be sufficient to meet seasonal and long-term capital needs.
25
The following table summarizes our significant contractual obligations as of December 31, 2007:
| Payments due by period (in thousands) | |||||||||||||||
| Contractual obligations (1) |
Total | Less than 1 year |
1-3 years | 3-5 years | More than 5 years | ||||||||||
| Long-term debt obligations, exclusive of interest |
$ | 261,651 | $ | 11,651 | $ | 46,429 | $ | 71,429 | $ | 132,142 | |||||
| Capital lease obligations, exclusive of interest |
2,103 | 542 | 1,561 | — | — | ||||||||||
| Operating lease obligations |
54,885 | 16,924 | 14,972 | 9,739 | 13,250 | ||||||||||
| Purchase obligations |
1,691 | 1,691 | — | — | — | ||||||||||
| Total |
$ | 320,330 | $ | 30,808 | $ | 62,962 | $ | 81,168 | $ | 145,392 | |||||
| (1) | Contractual obligations include long-term debt consisting primarily of senior notes totaling $261,500,000; capital lease obligations for computer equipment; operating leases primarily consisting of real estate leases; and purchase obligations relating to the remaining revenue equipment expected to be purchased under the definitive agreement to purchase select assets from Bullocks Express Transportation Inc., assuming that we are provided title to such equipment and the equipment is determined to be roadworthy. Please refer to the information regarding interest rates in this section above and also in Note 3 of the Notes to the Financial Statements included in Item 8 of this report. |
Critical Accounting Policies
In preparing our financial statements, we apply the following critical accounting policies that we believe affect our judgments and estimates of amounts recorded in certain assets, liabilities, revenue and expenses. These critical accounting policies are further described in Note 1 of the Notes to the Financial Statements included in Item 8 of this report.
Revenue Recognition – We recognize revenue based upon when our transportation services have been completed in accordance with the bill of lading contract, our general tariff provisions or contractual agreements with our customers. Generally, this occurs when we complete the delivery of a shipment. For transportation services not completed at the end of a reporting period, we use a percentage of completion method to allocate the appropriate revenue to each separate reporting period. Under this method, we develop a factor for each uncompleted shipment by dividing the actual number of days in transit at the end of a reporting period by that shipment’s standard delivery time schedule. This factor is applied to the total revenue for that shipment and revenue is allocated between reporting periods accordingly.
Allowances for Uncollectible Accounts and Revenue Adjustments – We maintain an allowance for uncollectible accounts for estimated losses resulting from the inability of our customers to make required payments. We estimate this allowance by analyzing the aging of our customer receivables, our historical loss experience and other trends and factors affecting the credit risk of our customers. Actual write-offs could differ from our allowance estimate as a result of several factors including changes in the overall economic environment or factors and risks surrounding our customers. Additional allowances may be required if the financial condition of our customers were to deteriorate, resulting in an impairment of their ability to make payments. We periodically review the underlying assumptions in our estimate of the allowance for uncollectible accounts so as to reflect the most recent trends and factors.
We also maintain an allowance for revenue adjustments resulting from billing corrections, customer allowances, money-back service guarantees and other miscellaneous revenue adjustments. These revenue adjustments are recorded in our revenue from operations. We use historical experience, trends and current information to update and evaluate these estimates.
26
Management believes the methodologies for estimating these allowances to be reliable based on the accuracy of our estimates in prior periods. As such, we do not anticipate any near-term changes in our methodologies for these estimates.
Claims and Insurance Accruals – Claims and insurance accruals reflect the estimated undiscounted cost of claims for cargo loss and damage, bodily injury and property damage, workers’ compensation, long-term disability and group health not covered by insurance. The related costs are charged to insurance and claims expense except for workers’ compensation, long-term disability and group health, which are charged to employee benefits expense.
Insurers providing excess coverage above retention levels adjust their premiums to cover insured losses and for other market factors. As a result, we periodically evaluate our self-insured retention levels to determine the most cost-efficient balance between self-insurance and excess coverage.
In establishing accruals for claims and insurance expenses, we evaluate and monitor each claim individually, and we use factors such as historical claims development experience, known trends and third-party estimates to determine the appropriate reserves for potential liability. We believe the assumptions and methods used to estimate these liabilities are reasonable; however, changes in the severity of previously-reported claims, significant changes in the medical costs and regulatory changes affecting the administration of our plans could significantly impact the determination of appropriate reserves in future periods.
Property and Equipment – Property and equipment are recorded at cost and depreciated on a straight-line basis over their estimated economic lives. Management uses historical experience, certain assumptions and estimates in determining the economic life of each asset. Periodically, we review property and equipment for impairment due to changes in operational and market conditions, and we adjust the carrying value and economic life of any impaired asset as appropriate. Currently, estimated economic lives for structures are 7 to 30 years; revenue equipment is 4 to 12 years; other equipment is 2 to 20 years; and leasehold improvements are the lesser of the economic life of the leasehold improvement or the remaining life of the lease. The use of different assumptions, estimates or significant changes in the resale market for our equipment could result in material changes in the carrying value and related depreciation of our assets.
Inflation
Most of our expenses are affected by inflation, which generally results in increased operating costs. In response to fluctuations in the cost of petroleum products, particularly diesel fuel, we have implemented a fuel surcharge in our tariffs and contractual agreements. The fuel surcharge was implemented to offset the cost of diesel fuel above a base price and increases as diesel fuel prices escalate over the base, which is generally indexed to the U.S. Department of Energy’s published fuel prices that reset each week. For the past three years, we do not believe that inflation has had a material effect on our results of operations.
Related Person Transactions
Family Relationships
Each of Earl E. Congdon, John R. Congdon, David S. Congdon, John R. Congdon, Jr. and John B. Yowell are related to one another and serve in various executive management positions and/or on our Board of Directors. In addition, Earl E. Congdon, John R. Congdon and David S. Congdon beneficially own 5% or more of our common stock. In 2004, we entered into employment agreements with Earl E. Congdon, John R. Congdon, David S. Congdon and John B. Yowell, which are filed as exhibits to our annual report on Form 10-K. We regularly disclose the amount of compensation that we pay to these individuals in the proxy statement for our annual meeting of shareholders.
27
Transactions with Old Dominion Truck Leasing, Inc.
Old Dominion Truck Leasing, Inc. (“Leasing”), a North Carolina corporation whose voting stock is owned by the Earl E. Congdon Intangibles Trust, David S. Congdon, Trustee; the John R. Congdon Revocable Trust; and members of Earl E. Congdon’s and John R. Congdon’s families, is primarily engaged in the business of purchasing and leasing tractors, trailers and other vehicles. John R. Congdon is Chairman of the Board of Leasing, and Earl E. Congdon is Vice Chairman of the Board of Leasing. Since 1986, we have combined our requirements with Leasing for the purchase of tractors, trailers, equipment, parts, tires and fuel. We believe that the termination of this arrangement would not have a material adverse impact on our financial results.
For the years ended December 31, 2007, 2006 and 2005, we charged Leasing $4,000, $3,000 and $1,000, respectively, for vehicle repair, maintenance and other services we provide to Leasing at cost plus a negotiated markup. On March 15, 2003, we entered into an agreement to sublease a vehicle maintenance facility in South Bend, Indiana, to Leasing for which we charged $6,000 in 2005. Leasing terminated this rental agreement effective June 30, 2005.
We purchased $257,000, $186,000 and $237,000 of maintenance and other services from Leasing in 2007, 2006 and 2005, respectively. We believe that the prices we pay for such services are lower than would be charged by unaffiliated third parties for the same quality of work, and we intend to continue to purchase maintenance and other services from Leasing, provided that Leasing’s prices continue to be favorable to us.
We also paid Leasing $588,000, $519,000 and $33,000 for leased equipment in 2007, 2006 and 2005, respectively. The leased equipment was primarily utilized by our customers, who reimbursed us for the lease amount through a periodic billing process that included charges for additional services we provided to these customers. We believe these leasing agreements are at arm’s length, and we received no commission or other financial benefit from Leasing or any other party in connection with these lease transactions.
Split Dollar Life Insurance Policies
We are the owner of two split-dollar life insurance contracts insuring the life of John R. Congdon. The net cash surrender value for these policies was $2,258,000 and $2,100,000 at December 31, 2007 and 2006, respectively, and is included in our financial statements under the caption “Other assets”. These policies provided for an aggregate of $4,584,000 in net death benefits due to the Company at December 31, 2007, of which we have endorsed $2,000,000 to Mr. Congdon’s spouse.
Audit Committee Approval
The Audit Committee of our Board of Directors reviewed and approved all of the related person transactions described above in accordance with the Company’s Related Person Transactions Policy.
| ITEM 7A. | QUANTITATIVE AND QUALITATIVE DISCLOSURES ABOUT MARKET RISK |
Market risk represents the risk of loss that may impact the consolidated financial position, results of operations and cash flows due to adverse changes in financial market prices and rates.
We are exposed to interest rate risk directly related to loans under our senior unsecured revolving credit agreements, which have variable interest rates. A 100 basis point increase in the average interest rate on this agreement would have no material effect on our operating results. We have established policies and procedures to manage exposure to market risks and use major institutions that are creditworthy to minimize credit risk.
We are exposed to interest rate and market risk related to our short-term investments, which includes variable rate demand obligations and auction rate securities. However, we invest in high quality investment grade securities with interest reset periods generally between 1 to 35 days. A 100 basis point decrease in the average
28
interest rate on our short-term investments would have no material effect on our operating results. At December 31, 2007, our balance of short-term investments was $24,375,000, of which $20,375,000 was rated AAA and/or Aaa by Standard and Poors (“S&P”) and Moody’s, respectively. The remaining $4,000,000 was rated AA+ by S&P. Due to recent negative publicity surrounding the auction rate security market, the Company reduced its exposure to this type of investment to $4,500,000 at February 28, 2008, without a realized gain or loss, and invested its excess cash in money market funds that are included in cash and equivalents. We do not believe any of the remaining balance of auction rate securities are impaired due to quality of the underlying securities, and we have the intent and ability to hold these securities until they reset in the event of an auction failure.
We are exposed to market risk for equity investments relating to Company owned life insurance contracts on certain employees. At December 31, 2007, the cash value for variable life insurance contracts was $8,162,000 of the total $13,295,000 of cash values for all life insurance contracts included on our balance sheet in “Other assets”. Variable life insurance contracts expose the Company to fluctuations in equity markets; however, we utilize a third-party to manage these assets and minimize that exposure. A 10% change in market value in those investments would have an $816,200 impact on our operating results.
We are also exposed to commodity price risk related to diesel fuel prices and have established policies and procedures to manage our exposure to that risk.
For further discussion related to these risks, see Notes 2 and 3 of the Notes to the Financial Statements included in Item 8 of this report and “Management’s Discussion and Analysis of Financial Condition and Results of Operations” included in Item 7 of this report.
29
ITEM 8. FINANCIAL STATEMENTS AND SUPPLEMENTARY DATA
OLD DOMINION FREIGHT LINE, INC.
BALANCE SHEETS
| December 31, | ||||||||
| (In thousands, except share data) |
2007 | 2006 | ||||||
| ASSETS |
||||||||
| Current assets: |
||||||||
| Cash and cash equivalents |
$ | 6,328 | $ | 2,564 | ||||
| Short-term investments |
24,375 | 85,160 | ||||||
| Customer receivables, less allowances of $12,122 and $10,677, respectively |
151,627 | 141,087 | ||||||
| Other receivables |
6,534 | 3,904 | ||||||
| Prepaid expenses |
13,449 | 11,332 | ||||||
| Deferred income taxes |
13,964 | 12,320 | ||||||
| Total current assets |
216,277 | 256,367 | ||||||
| Property and equipment: |
||||||||
| Revenue equipment |
577,385 | 494,046 | ||||||
| Land and structures |
377,557 | 308,537 | ||||||
| Other fixed assets |
129,174 | 111,854 | ||||||
| Leasehold improvements |
2,508 | 2,045 | ||||||
| Total property and equipment |
1,086,624 | 916,482 | ||||||
| Less accumulated depreciation |
(365,174 | ) | (308,894 | ) | ||||
| Net property and equipment |
721,450 | 607,588 | ||||||
| Intangible assets, net |
23,518 | 16,772 | ||||||
| Other assets |
19,803 | 11,466 | ||||||
| Total assets |
$ | 981,048 | $ | 892,193 | ||||
| LIABILITIES AND SHAREHOLDERS’ EQUITY |
||||||||
| Current liabilities: |
||||||||
| Accounts payable |
$ | 33,341 | $ | 37,686 | ||||
| Compensation and benefits |
38,710 | 35,649 | ||||||
| Claims and insurance accruals |
30,255 | 23,871 | ||||||
| Other accrued liabilities |
13,224 | 11,643 | ||||||
| Current maturities of long-term debt |
12,193 | 12,697 | ||||||
| Total current liabilities |
127,723 | 121,546 | ||||||
| Long-term debt |
251,561 | 261,885 | ||||||
| Other non-current liabilities |
50,000 | 39,027 | ||||||
| Deferred income taxes |
62,312 | 52,115 | ||||||
| Total long-term liabilities |
363,873 | 353,027 | ||||||
| Total liabilities |
491,596 | 474,573 | ||||||
| Shareholders’ equity: |
||||||||
| Common stock – $0.10 par value, 70,000,000 shares authorized, 37,284,675 shares outstanding at December 31, 2007 and 2006 |
3,728 | 3,728 | ||||||
| Capital in excess of par value |
90,893 | 90,893 | ||||||
| Retained earnings |
394,831 | 322,999 | ||||||
| Total shareholders’ equity |
489,452 | 417,620 | ||||||
| Commitments and contingencies |
— | — | ||||||
| Total liabilities and shareholders’ equity |
$ | 981,048 | $ | 892,193 | ||||
The accompanying notes are an integral part of these financial statements.
30
OLD DOMINION FREIGHT LINE, INC.
STATEMENTS OF OPERATIONS
| Year ended December 31, | ||||||||||||
| (In thousands, except share and per share data) |
2007 | 2006 | 2005 | |||||||||
| Revenue from operations |
$ | 1,401,542 | $ | 1,279,431 | $ | 1,061,403 | ||||||
| Operating expenses: |
||||||||||||
| Salaries, wages and benefits |
751,371 | 682,886 | 585,879 | |||||||||
| Operating supplies and expenses |
238,879 | 204,386 | 158,029 | |||||||||
| General supplies and expenses |
40,075 | 37,507 | 31,940 | |||||||||
| Operating taxes and licenses |
50,874 | 46,693 | 38,961 | |||||||||
| Insurance and claims |
33,347 | 33,080 | 28,143 | |||||||||
| Communications and utilities |
15,023 | 14,278 | 12,573 | |||||||||
| Depreciation and amortization |
79,863 | 67,634 | 55,897 | |||||||||
| Purchased transportation |
43,889 | 43,933 | 35,005 | |||||||||
| Building and office equipment rents |
11,910 | 11,143 | 9,490 | |||||||||
| Miscellaneous expenses, net |
6,374 | 7,406 | 7,901 | |||||||||
| Total operating expenses |
1,271,605 | 1,148,946 | 963,818 | |||||||||
| Operating income |
129,937 | 130,485 | 97,585 | |||||||||
| Non-operating expense (income): |
||||||||||||
| Interest expense |
14,466 | 12,443 | 6,683 | |||||||||
| Interest income |
(1,506 | ) | (2,237 | ) | (156 | ) | ||||||
| Other expense, net |
1,182 | 936 | 787 | |||||||||
| Total non-operating expense |
14,142 | 11,142 | 7,314 | |||||||||
| Income before income taxes and cumulative effect of accounting change |
115,795 | 119,343 | 90,271 | |||||||||
| Provision for income taxes |
43,963 | 46,774 | 36,388 | |||||||||
| Income before cumulative effect of accounting change |
71,832 | 72,569 | 53,883 | |||||||||
| Cumulative effect of accounting change (net of income tax effect of $272) |
— | — | 408 | |||||||||
| Net income |
$ | 71,832 | $ | 72,569 | $ | 53,475 | ||||||
| Basic earnings per share before cumulative effect of accounting change |
$ | 1.93 | $ | 1.95 | $ | 1.45 | ||||||
| Cumulative effect of accounting change |
— | — | (0.02 | ) | ||||||||
| Basic earnings per share |
$ | 1.93 | $ | 1.95 | $ | 1.43 | ||||||
| Diluted earnings per share before cumulative effect of accounting change |
$ | 1.93 | $ | 1.95 | $ | 1.45 | ||||||
| Cumulative effect of accounting change |
— | — | (0.02 | ) | ||||||||
| Diluted earnings per share |
$ | 1.93 | $ | 1.95 | $ | 1.43 | ||||||
| Weighted average shares outstanding: |
||||||||||||
| Basic |
37,284,675 | 37,284,675 | 37,272,892 | |||||||||
| Diluted |
37,284,675 | 37,284,675 | 37,276,322 | |||||||||
The accompanying notes are an integral part of these financial statements.
31
OLD DOMINION FREIGHT LINE, INC.
STATEMENTS OF CHANGES IN SHAREHOLDERS’ EQUITY
| Common Stock | Capital in excess of par value |
Retained earnings |
Total | |||||||||||||
| (In thousands) |
Shares | Amount | ||||||||||||||
| Balance as of December 31, 2004 |
37,268 | $ | 3,726 | $ | 90,847 | $ | 196,955 | $ | 291,528 | |||||||
| Net income |
— | — | — | 53,475 | 53,475 | |||||||||||
| Exercise of common stock options |
17 | 2 | 48 | — | 50 | |||||||||||
| Other |
— | — | (2 | ) | — | (2 | ) | |||||||||
| Balance as of December 31, 2005 |
37,285 | 3,728 | 90,893 | 250,430 | 345,051 | |||||||||||
| Net income |
— | — | — | 72,569 | 72,569 | |||||||||||
| Balance as of December 31, 2006 |
37,285 | 3,728 | 90,893 | 322,999 | 417,620 | |||||||||||
| Net income |
— | — | — | 71,832 | 71,832 | |||||||||||
| Balance as of December 31, 2007 |
37,285 | $ | 3,728 | $ | 90,893 | $ | 394,831 | $ | 489,452 | |||||||
The accompanying notes are an integral part of these financial statements.
32
OLD DOMINION FREIGHT LINE, INC.
STATEMENTS OF CASH FLOWS
| Year ended December 31, | ||||||||||||
| (In thousands) |
2007 | 2006 | 2005 | |||||||||
| Cash flows from operating activities: |
||||||||||||
| Net income |
$ | 71,832 | $ | 72,569 | $ | 53,475 | ||||||
| Adjustments to reconcile net income to net cash provided by operating activities: |
||||||||||||
| Cumulative effect of accounting change, net of tax |
— | — | 408 | |||||||||
| Depreciation and amortization |
79,863 | 67,634 | 55,897 | |||||||||
| (Gain) loss on sale of property and equipment |
(1,761 | ) | (245 | ) | 1,108 | |||||||
| Deferred income taxes |
8,553 | 7,703 | (2,350 | ) | ||||||||
| Other, net |
— | — | 759 | |||||||||
| Changes in assets and liabilities, net of acquisition effects: |
||||||||||||
| Customer and other receivables, net |
(11,687 | ) | (15,573 | ) | (20,769 | ) | ||||||
| Prepaid expenses and other assets |
(6,622 | ) | (486 | ) | (5,338 | ) | ||||||
| Accounts payable |
(4,345 | ) | 6,719 | 5,662 | ||||||||
| Compensation, benefits and other accrued liabilities |
4,546 | 10,967 | 8,416 | |||||||||
| Claims and insurance accruals |
11,568 | 4,755 | 12,763 | |||||||||
| Income taxes payable |
— | (4,078 | ) | 2,704 | ||||||||
| Other liabilities |
5,789 | 4,645 | 887 | |||||||||
| Net cash provided by operating activities |
157,736 | 154,610 | 113,622 | |||||||||
| Cash flows from investing activities: |
||||||||||||
| Purchase of property and equipment |
(186,828 | ) | (199,098 | ) | (142,596 | ) | ||||||
| Proceeds from sale of property and equipment |
5,228 | 5,626 | 5,221 | |||||||||
| Purchase of short-term investment securities |
(160,675 | ) | (302,346 | ) | — | |||||||
| Proceeds from sale of short-term investment securities |
221,460 | 217,186 | — | |||||||||
| Acquisition of business assets |
(20,431 | ) | (19,414 | ) | (23,113 | ) | ||||||
| Net cash used in investing activities |
(141,246 | ) | (298,046 | ) | (160,488 | ) | ||||||
| Cash flows from financing activities: |
||||||||||||
| Proceeds from issuance of long-term debt |
— | 175,000 | 75,772 | |||||||||
| Principal payments under long-term debt agreements |
(12,726 | ) | (17,901 | ) | (22,399 | ) | ||||||
| Net payments on revolving line of credit |
— | (11,473 | ) | (5,860 | ) | |||||||
| Other financing activities, net |
— | (612 | ) | (403 | ) | |||||||
| Net cash (used in) provided by financing activities |
(12,726 | ) | 145,014 | 47,110 | ||||||||
| Increase in cash and cash equivalents |
3,764 | 1,578 | 244 | |||||||||
| Cash and cash equivalents at beginning of year |
2,564 | 986 | 742 | |||||||||
| Cash and cash equivalents at end of year |
$ | 6,328 | $ | 2,564 | $ | 986 | ||||||
| Income taxes paid |
$ | 38,535 | $ | 45,462 | $ | 35,844 | ||||||
| Interest paid |
$ | 15,749 | $ | 11,875 | $ | 6,450 | ||||||
| Capitalized interest |
$ | 1,324 | $ | 773 | $ | 518 | ||||||
| Supplemental disclosure of noncash investing and financing activities: |
||||||||||||
| Acquisition of property and equipment by capital lease |
$ | 1,898 | $ | — | $ | 1,989 | ||||||
| Fair value of property exchanged |
$ | 5,374 | $ | — | $ | 1,650 | ||||||
The accompanying notes are an integral part of these financial statements.
33
OLD DOMINION FREIGHT LINE, INC.
NOTES TO THE FINANCIAL STATEMENTS
Note 1. Significant Accounting Policies
Business
We are a less-than-truckload multi-regional motor carrier providing one-to-five day service among six regions in the United States and next-day and second-day service within these regions. At December 31, 2007, we provided 100% full-state coverage to 38 of the 47 states that we served directly within the Southeast, Gulf Coast, Northeast, Midwest, Central and West regions of the country. Through marketing and carrier relationships, Old Dominion Freight Line, Inc. also provided service to and from the remaining states as well as international services around the globe.
Basis of Presentation
The financial statements were consolidated for all periods prior to June 30, 2005 and include the accounts of Old Dominion Freight Line, Inc. and its then-wholly owned and sole subsidiary. All significant intercompany balances and transactions were eliminated in consolidation. The subsidiary was dissolved on a voluntary basis by its Board of Directors without an income statement impact and its assets were transferred to the Company effective June 30, 2005.
The preparation of financial statements in conformity with U.S. generally accepted accounting principles requires management to make estimates and assumptions that affect the amounts reported in the financial statements and accompanying notes. Actual results could differ from these estimates.
Certain amounts in prior years have been reclassified to conform prior years’ financial statements to the current presentation.
Unless the context requires otherwise, references in these Notes to “Old Dominion”, the “Company”, “we”, “us” and “our” refer to Old Dominion Freight Line, Inc.
Segments
We operate one business segment and have no customer that exceeds 10% of our operating revenue.
Revenue and Expense Recognition
We recognize revenue based upon when our transportation services have been completed in accordance with the bill of lading contract, our general tariff provisions or contractual agreements with our customers. Generally, this occurs when we complete the delivery of a shipment. For transportation services not completed at the end of a reporting period, we use a percentage of completion method to allocate the appropriate revenue to each separate reporting period. Under this method, we develop a factor for each uncompleted shipment by dividing the actual number of days in transit at the end of a reporting period by that shipment’s standard delivery time schedule. This factor is applied to the total revenue for that shipment and revenue is allocated between reporting periods accordingly.
Expenses are recognized when incurred.
Allowances for Uncollectible Accounts and Revenue Adjustments
We maintain an allowance for uncollectible accounts for estimated losses resulting from the inability of our customers to make required payments. We estimate this allowance by analyzing the aging of our customer receivables, our historical loss experience and other trends and factors affecting the credit risk of our customers. Write-offs occur when we determine an account to be uncollectible and could differ from our allowance estimate
34
OLD DOMINION FREIGHT LINE, INC.
NOTES TO THE FINANCIAL STATEMENTS—(Continued)
as a result of factors such as changes in the overall economic environment or risks surrounding our customers. Additional allowances may be required if the financial condition of our customers were to deteriorate, resulting in an impairment of their ability to make payments. We continually review the underlying assumptions in our estimate of the allowance for uncollectible accounts so as to reflect the most recent trends and factors.
We also maintain an allowance for revenue adjustments resulting from billing corrections, customer allowances, money-back service guarantees and other miscellaneous revenue adjustments. These revenue adjustments are recorded in our revenue from operations. We use historical experience, trends and current information to update and evaluate these estimates.
Credit Risk
Financial instruments that potentially subject us to concentrations of credit risk consist principally of customer receivables and short-term investments. We perform initial and ongoing credit evaluations of our customers to minimize credit risk. We generally do not require collateral but may require prepayment of our services under certain circumstances. Credit risk is generally diversified due to the large number of entities comprising our customer base and their dispersion across many different industries and geographic regions. We invest in high quality investment grade securities, in accordance with our investment policy, with interest reset periods generally between 1 to 35 days to minimize credit risk. Interest rates on auction-rate securities reset based on an auction bid process that resets the interest rate of the security. An auction can fail when there is insufficient demand for a security; however, a failed auction by itself does not indicate an increased credit risk with the underlying security. At December 31, 2007, our balance of short-term investments was $24,375,000, of which $20,375,000 was rated AAA and/or Aaa by Standard and Poors (“S&P”) and Moody’s, respectively. The remaining $4,000,000 was rated AA+ by S&P.
Cash and Cash Equivalents
We consider cash on hand and deposits in banks along with certificates of deposit and short-term marketable securities with original maturities of three months or less as cash and cash equivalents.
Short-term Investments
Short-term investments are classified as available-for-sale and reported on the balance sheets at fair value in accordance with Statement of Financial Accounting Standards (“SFAS”) No. 115, Accounting for Certain Investments In Debt and Equity Securities. The cost of securities sold is based on the specific identification method and unrealized gains and losses, if any, are reported net of tax in accumulated other comprehensive income. There were no unrealized gains or losses as of December 31, 2007 or 2006. Interest income related to these investments is included in “Interest income” on the statements of operations.
Tires on Equipment
Prior to 2005, the cost of original and replacement tires mounted on equipment was reported as a current asset in tires on equipment, and amortized based on usage determined by periodic samplings of tread depth. In the fourth quarter of 2005, we changed our policy for accounting for tires and began capitalizing the cost of tires mounted on purchased revenue equipment as a part of the total equipment cost of such equipment. Under the new policy, subsequent replacement tires are expensed at the time those tires are placed in service similar to other repairs and maintenance costs. We believe that this new method provides a more precise and less subjective method to account for tires on equipment due to our growth and geographic expansion and is consistent with industry practice. The cumulative effect of the change as of January 1, 2005 was a $408,000 decrease to net income (net of tax benefit of $272,000) or $0.02 per diluted share.
35
OLD DOMINION FREIGHT LINE, INC.
NOTES TO THE FINANCIAL STATEMENTS—(Continued)
Property and Equipment
Property and equipment is stated at cost. Major additions and improvements are capitalized, while maintenance and repairs that do not improve or extend the lives of the respective assets are charged to expense as incurred.
Depreciation is provided by the straight-line method over the following estimated useful lives:
| Structures |
7 to 30 years | |
| Revenue equipment |
4 to 12 years | |
| Other equipment |
2 to 20 years | |
| Leasehold improvements |
Lesser of economic life or life of lease |
Depreciation expense, which includes the amortization of capital leases, was $79,370,000, $67,254,000 and $55,667,000 for 2007, 2006 and 2005, respectively.
Goodwill and Other Intangible Assets
Intangible assets have been acquired in connection with business combinations and are comprised of goodwill, which is the excess cost over the fair value of assets acquired, and other intangible assets. Other intangible assets include the value of acquired customer lists and related noncompete agreements and are amortized on a straight-line basis over their estimated useful lives, none of which exceeds ten years. Other intangible assets, net of accumulated amortization, were $4,977,000 and $3,220,000 at December 31, 2007 and 2006, respectively. Amortization expense was $493,000, $380,000 and $230,000 for 2007, 2006 and 2005, respectively.
SFAS No. 142, Goodwill and Other Intangible Assets, requires impairment testing on an annual measurement date unless circumstances dictate more frequent assessments. The initial step in testing for goodwill impairment is to compare the fair value of each reporting unit with its book value. To the extent the fair value is less than book value, which would indicate the potential that impairment of goodwill exists, a second test is required to determine the amount of impairment. We completed the required annual analysis of our goodwill on our annual measurement date of October 1, 2007, and determined that there was no impairment of goodwill.
Long-Lived Assets
We assess the realizable value of our long-lived assets and evaluate such assets for impairment whenever events or changes in circumstances indicate the carrying amount of an asset may not be recoverable, as required by SFAS No. 144, Accounting for the Impairment and Disposal of Long-Lived Assets.
Claims and Insurance Accruals
We are currently self-insured for bodily injury and property damage claims up to $2,750,000 per occurrence. Cargo loss and damage claims are self-insured up to $100,000 per occurrence. We are exposed to workers’ compensation claims up to $1,000,000 per occurrence, through either self-insurance or insurance deductibles, for the states in which we operate. Group health claims are self-insured up to $325,000 per occurrence and long-term disability claims are self-insured to a maximum per individual of $3,000 per month.
Claims and insurance accruals reflect the estimated undiscounted cost of claims for cargo loss and damage, bodily injury and property damage, workers’ compensation, long-term disability and group health not covered by insurance. These accruals include amounts for future claim development and claims incurred but not reported,
36
OLD DOMINION FREIGHT LINE, INC.
NOTES TO THE FINANCIAL STATEMENTS—(Continued)
which are primarily based on historical claims development experience. The related costs are charged to insurance and claims expense except for workers’ compensation, long-term disability and group health, which are charged to employee benefits expense.
We reserved $63,754,000 and $52,186,000 at December 31, 2007 and 2006, respectively, for self-insured claims and insurance reserves on our Balance Sheets. The long-term portions of those reserves were $33,499,000 and $28,315,000 for 2007 and 2006, respectively, which were included in “Other non-current liabilities”.
Advertising
The costs of advertising our services are expensed as incurred. Advertising costs charged to expense amounted to $2,866,000, $2,831,000 and $2,245,000 for 2007, 2006 and 2005, respectively.
Fair Values of Financial Instruments
At December 31, 2007 and 2006, the carrying values of financial instruments such as cash and cash equivalents, customer and other receivables and trade payables approximates their fair value due to the short maturities of these instruments. The cash surrender value relating to Company owned life insurance contracts is included in “Other assets” and totaled $13,295,000 and $9,074,000 at December 31, 2007 and 2006, respectively, which approximates the fair value as determined by quoted market prices. Long-term debt approximated its fair value and is based on quoted market prices for debt of the same remaining maturity and other characteristics or discounted cash flows, as appropriate.
Earnings Per Share
Earnings per common share is computed using the weighted average number of common shares outstanding during the period. There were no remaining unexercised employee stock options at December 31, 2005 and the effect of dilutive employee stock options in Note 8 is immaterial to the calculation of diluted earnings per share for 2005.
Common Stock Split
On October 31, 2005, the Board of Directors approved a three-for-two common stock split for shareholders of record as of the close of business on November 16, 2005. On November 30, 2005, those shareholders received one additional share of common stock for every two shares owned. All references in this report to shares outstanding, weighted average shares outstanding and earnings per share amounts have been restated retroactively for this stock split.
Share-Based Compensation
Effective January 1, 2006 Old Dominion adopted SFAS No. 123(R), Share-Based Payment. This Statement, which is a revision of SFAS No. 123, Accounting for Stock-Based Compensation, supersedes APB Opinion No. 25, Accounting for Stock Issued to Employees, and amends SFAS No. 95, Statement of Cash Flows. Generally the approach in SFAS No. 123(R) is similar to the approach described in SFAS No. 123. However, SFAS No. 123(R) requires all share-based payments to employees to be recognized in the income statement based on their fair values. Pro forma disclosure is no longer an alternative. We consider the liability for the phantom shares awarded under the Old Dominion Freight Line, Inc. Phantom Stock Plan to be immaterial and have no remaining unexercisable employee stock options. See Note 8 for further discussion of our share-based compensation arrangements.
37
OLD DOMINION FREIGHT LINE, INC.
NOTES TO THE FINANCIAL STATEMENTS—(Continued)
Recent Accounting Pronouncements
In September 2006, the Financial Accounting Standards Board (“FASB”) issued SFAS No. 157, Fair Value Measurements, which provides enhanced guidance for using fair value to measure assets and liabilities. This standard expands information about the extent to which the Company measures assets and liabilities at fair value, the information used to measure fair value and the effect of fair value measurements on earnings. It does not expand on the use of fair value in any new circumstances. SFAS No. 157 applies whenever other standards require (or permit) assets or liabilities to be measured at fair value and is effective for fiscal years beginning after November 15, 2007, and interim periods within those fiscal years. However, FASB Staff Position No. 157-2 defers the effective date of SFAS No. 157 for nonfinancial assets and nonfinancial liabilities, except for items that are recognized or disclosed at fair value in an entity’s financial statements on a recurring basis (at least annually) to fiscal years beginning after November 15, 2008, and interim periods within those fiscal years. The Company does not expect the adoption of SFAS No. 157 to have a material impact on its financial position, results of operations or cash flows.
In February 2007, the FASB issued SFAS No. 159, The Fair Value Option for Financial Assets and Financial Liabilities, which permits the Company to choose to measure many financial instruments and certain other items at fair value and establishes presentation and disclosure requirements designed to facilitate comparisons between companies that choose different measurement attributes for similar types of assets and liabilities. SFAS No. 159 will become effective January 1, 2008 and the Company does not expect the adoption of this statement to have a material impact on its financial position, results of operations or cash flows.
In December 2007, the FASB issued SFAS No. 141 (revised 2007), Business Combinations. The objective of SFAS No. 141R is to improve the relevance, representational faithfulness, and comparability of the information that the Company provides in its financial reports about a business combination and its effects. SFAS No. 141R established principles and requirements for how the acquirer: (i) recognizes and measures in its financial statements the identifiable assets acquired, the liabilities assumed and any noncontrolling interest in the acquiree; (ii) recognizes and measures the goodwill acquired in the business combination or a gain from a bargain purchase; and (iii) determines what information to disclose to enable users of the financial statements to evaluate the nature and financial effects of the business combination. SFAS No. 141R applies prospectively to business combinations for which the acquisition date is on or after January 1, 2009, and the Company does not expect the adoption of this statement to have a material impact on its financial position, results of operations or cash flows.
In December 2007, the FASB issued SFAS No. 160, Noncontrolling Interests in Consolidated Financial Statements — an amendment of ARB No. 51. The objective of SFAS No. 160 is to improve the relevance, comparability and transparency of the financial information that a reporting entity provides in its consolidated financial statements by (i) clarifying the classification of noncontrolling interests in consolidated statements of financial position and the accounting for and reporting of transactions between the reporting entity and holders of such noncontrolling interests, and (ii) establishing accounting and reporting standards for the noncontrolling interest in a subsidiary and for the deconsolidation of a subsidiary. SFAS No. 160 will become effective January 1, 2009 and the Company does not expect the adoption of this statement to have a material impact on its financial position, results of operations or cash flows.
Note 2. Short-term Investments
Short-term investments consist of auction-rate securities and variable rate demand obligations, both of which are securities with an underlying component of a long-term debt instrument. At December 31, 2007 and 2006, the underlying instruments were debt securities issued by states of the United States and/or local municipal
38
OLD DOMINION FREIGHT LINE, INC.
NOTES TO THE FINANCIAL STATEMENTS—(Continued)
authorities in those states. Interest rates on auction-rate securities reset on a shorter term than the underlying instrument based on an auction bid process that resets the interest rate of the security. The auction or reset dates occur at intervals that are generally between 7 and 35 days of the purchase. An auction can fail when there is insufficient demand for a security. In the event that an auction fails, the interest rates reset at a rate based on a formula determined by the individual security, which is generally higher than current market rates, until the next auction date. Variable rate demand obligations have a coupon rate that is generally reset daily or weekly, and the Company has the option to put the security back to the trustee or tender agent at par on any business day with proceeds received either the same day or in seven days, depending on the mode of reset. Short-term investments are classified as current assets due to these rate-setting mechanisms and the ability to liquidate.
The Company’s short-term investments are classified as available-for-sale and are reported in the balance sheets at fair value. There were no unrealized gains or losses at December 31, 2007 or 2006.
We sold $221,460,000 and $217,186,000 of short-term investments during the years ended December 31, 2007 and 2006, respectively, with no realized gains or losses. The interest earned from these investments is exempt from federal taxes, as well as state taxes in the state of the underlying debt instrument.
The carrying values of our short-term investments by ultimate contractual maturity of the underlying instruments at December 31, 2007 are shown below. Actual maturities may differ from the contractual maturities because the issuers of the securities may have the right to prepay obligations.
| (In thousands) |
|||
| Due within 1 year |
$ | — | |
| Due after 1 year through 5 years |
— | ||
| Due after 5 years through 10 years |
— | ||
| Due after 10 years |
24,375 | ||
| $ | 24,375 | ||
Note 3. Long-term Debt
Long-term debt consisted of the following:
| December 31, | ||||||
| (In thousands) |
2007 | 2006 | ||||
| Senior notes |
$ | 261,500 | $ | 273,000 | ||
| Revolving credit facility |
— | — | ||||
| Capitalized lease obligations |
2,103 | 1,156 | ||||
| Other obligations |
151 | 426 | ||||
| Total long-term debt |
263,754 | 274,582 | ||||
| Less current maturities |
12,193 | 12,697 | ||||
| Total maturities due after one year |
$ | 251,561 | $ | 261,885 | ||
We have four unsecured senior note agreements outstanding totaling $261,500,000 at December 31, 2007. These notes call for periodic principal payments with maturities ranging from 2008 to 2016, of which $11,500,000 is due in the next twelve months. Interest rates on these notes are fixed and range from 4.68% to 6.93%. The effective average interest rate on our outstanding senior note agreements was 5.56% and 5.62% at December 31, 2007 and 2006, respectively.
39
OLD DOMINION FREIGHT LINE, INC.
NOTES TO THE FINANCIAL STATEMENTS—(Continued)
We entered into a five-year, $225,000,000 senior unsecured revolving credit facility pursuant to the terms of an amended and restated credit agreement (the “Credit Agreement”), dated August 10, 2006, with Wachovia Bank, National Association serving as administrative agent for the lenders. This Credit Agreement amended and restated the terms of the existing $110,000,000 senior unsecured revolving credit facility dated September 22, 2005, as amended. Of the $225,000,000 line of credit commitments, $150,000,000 may be used for letters of credit and $15,000,000 may be used for borrowings under Wachovia’s sweep program. The sweep program is a daily cash management tool that automatically initiates borrowings to cover overnight cash requirements up to an aggregate of $15,000,000 or initiates overnight investments for excess cash balances. In addition, we have the right to request an increase in the line of credit commitments up to a total of $300,000,000 in minimum increments of $25,000,000. At our option, revolving loans under the facility bear interest at either: (a) the higher of Wachovia Bank’s prime rate or the federal funds rate plus 0.5% per annum (the “Base Rate”); (b) LIBOR (one, two, three or six months) plus an applicable margin (the “Adjusted LIBOR Rate”); or (c) one-month LIBOR plus an applicable margin (the “LIBOR Index Rate”). The applicable margin is determined by a pricing grid in the Credit Agreement and ranges from 0.5% to 1.125%. The applicable margin for the Credit Agreement in 2007 was 0.625%. Revolving loans under the sweep program bear interest at the LIBOR Index Rate.
The Credit Agreement contains customary covenants, including financial covenants that require us to observe a maximum ratio of debt to total capital and a minimum fixed charge coverage ratio. Any future wholly owned subsidiaries of the Company would be required to guarantee payment of all of our obligations under the facility. At December 31, 2007, there was no outstanding balance on the line of credit facility and there was $51,717,000 of outstanding letters of credit.
Commitment fees ranging from 0.1% to 0.225% are charged quarterly in arrears on the aggregate unutilized portion of the Credit Agreement. Letter of credit fees equal to the applicable margin for Adjusted LIBOR Rate loans are charged quarterly in arrears on the daily average aggregate stated amount of all letters of credit outstanding during the quarter. The commitment fees and letter of credit fees were 0.125% and 0.625%, respectively, for the Credit Agreement in 2007. In addition, a facing fee at an annual rate of 0.125% is charged quarterly in arrears on the daily average aggregate stated amount of all letters of credit outstanding during such quarter.
Our senior notes and Credit Agreement limit the amount of dividends that may be paid to shareholders pursuant to certain financial ratios. Our Credit Agreement, which was the most restrictive at December 31, 2007, limits the amount of dividends that could be paid to shareholders to the greater of (i) $10,000,000, (ii) the amount of dividends paid in the immediately preceding fiscal year, or (iii) an amount equal to 25% of net income from the immediately preceding fiscal year. We did not declare or pay a dividend on our common stock in 2007 or 2006.
Capitalized lease obligations are collateralized by property and equipment with a book value of $2,025,000 at December 31, 2007.
40
OLD DOMINION FREIGHT LINE, INC.
NOTES TO THE FINANCIAL STATEMENTS—(Continued)
As of December 31, 2007, aggregate maturities of long-term debt are as follows:
| (In thousands) |
|||
| 2008 |
$ | 12,193 | |
| 2009 |
11,479 | ||
| 2010 |
36,511 | ||
| 2011 |
35,714 | ||
| 2012 |
35,714 | ||
| Thereafter |
132,143 | ||
| $ | 263,754 | ||
Note 4. Leases
We lease certain information systems under capital leases. We also lease other assets under operating leases, which primarily consist of real estate leases for 95 of our 192 service center locations at December 31, 2007.
Certain operating leases provide for renewal options. Renewal options and length of renewals vary by lease and are typically offered at their fair rental value. We have not made any residual value guarantees related to our operating leases, including those for revenue equipment, and, therefore, have no such liability recorded on our balance sheet.
The assets under capital leases are included in property and equipment as follows:
| December 31, | ||||||||
| (In thousands) |
2007 | 2006 | ||||||
| Information systems |
$ | 2,986 | $ | 6,632 | ||||
| Less accumulated amortization |
(961 | ) | (5,210 | ) | ||||
| $ | 2,025 | $ | 1,422 | |||||
Future minimum annual lease payments as of December 31, 2007, are as follows:
| (In thousands) |
Capital leases |
Operating leases |
Total | |||||||
| 2008 |
$ | 624 | $ | 16,924 | $ | 17,548 | ||||
| 2009 |
814 | 8,763 | 9,577 | |||||||
| 2010 |
815 | 6,209 | 7,024 | |||||||
| 2011 |
— | 7,134 | 7,134 | |||||||
| 2012 |
— | 2,605 | 2,605 | |||||||
| Thereafter |
— | 13,250 | 13,250 | |||||||
| Total minimum lease payments |
2,253 | $ | 54,885 | $ | 57,138 | |||||
| Less amount representing interest |
(150 | ) | ||||||||
| Present value of capitalized lease obligations |
$ | 2,103 | ||||||||
Aggregate expense under operating leases approximated $18,400,000, $16,556,000 and $14,164,000 for 2007, 2006 and 2005, respectively.
41
OLD DOMINION FREIGHT LINE, INC.
NOTES TO THE FINANCIAL STATEMENTS—(Continued)
Note 5. Income Taxes
The components of the provision for income taxes are as follows:
| Year ended December 31, | ||||||||||
| (In thousands) |
2007 | 2006 | 2005 | |||||||
| Current: |
||||||||||
| Federal |
$ | 30,108 | $ | 33,401 | $ | 33,771 | ||||
| State |
5,302 | 5,670 | 4,967 | |||||||
| 35,410 | 39,071 | 38,738 | ||||||||
| Deferred: |
||||||||||
| Federal |
7,096 | 6,310 | (2,459 | ) | ||||||
| State |
1,457 | 1,393 | 109 | |||||||
| 8,553 | 7,703 | (2,350 | ) | |||||||
| Total provision for income taxes |
$ | 43,963 | $ | 46,774 | $ | 36,388 | ||||
The following is a reconciliation of the statutory federal income tax rates with our effective income tax rates for 2007, 2006 and 2005:
| Year ended December 31, | ||||||||||||
| (In thousands) |
2007 | 2006 | 2005 | |||||||||
| Tax provision at statutory rate on income before income taxes and cumulative effect of accounting change |
$ | 40,528 | $ | 41,770 | $ | 31,595 | ||||||
| State income taxes, net of federal benefit |
4,369 | 4,734 | 3,459 | |||||||||
| Meals and entertainment disallowance |
822 | 708 | 597 | |||||||||
| Tax credits |
(1,172 | ) | (41 | ) | (12 | ) | ||||||
| Other, net |
(584 | ) | (397 | ) | 749 | |||||||
| Total provision for income taxes |
$ | 43,963 | $ | 46,774 | $ | 36,388 | ||||||
Deferred tax assets and liabilities consist of the following:
| December 31, | ||||||||
| (In thousands) |
2007 | 2006 | ||||||
| Deferred tax assets: |
||||||||
| Claims and insurance reserves |
$ | 24,867 | $ | 23,225 | ||||
| Allowance for doubtful accounts |
4,065 | 3,540 | ||||||
| Accrued vacation |
7,108 | 6,112 | ||||||
| Other |
7,116 | 5,098 | ||||||
| 43,156 | 37,975 | |||||||
| Deferred tax liabilities: |
||||||||
| Depreciation |
(81,989 | ) | (67,649 | ) | ||||
| Unrecognized revenue |
(5,810 | ) | (6,003 | ) | ||||
| Employee benefits |
(2,158 | ) | (2,870 | ) | ||||
| Other |
(1,547 | ) | (1,248 | ) | ||||
| (91,504 | ) | (77,770 | ) | |||||
| Net deferred tax liability |
$ | (48,348 | ) | $ | (39,795 | ) | ||
42
OLD DOMINION FREIGHT LINE, INC.
NOTES TO THE FINANCIAL STATEMENTS—(Continued)
The net current asset and noncurrent liability consist of the following:
| December 31, | ||||||||
| (In thousands) |
2007 | 2006 | ||||||
| Current deferred tax asset |
$ | 13,964 | $ | 12,320 | ||||
| Noncurrent deferred tax liability |
(62,312 | ) | (52,115 | ) | ||||
| Net deferred tax liability |
$ | (48,348 | ) | $ | (39,795 | ) | ||
In July 2006, the FASB issued FASB interpretation No. 48, Accounting for Uncertainty in Income Taxes (“FIN 48”), which clarified the accounting for uncertainty on income tax positions in accordance with Statement of Financial Accounting Standards No. 109, Accounting for Income Taxes. We adopted FIN 48 on January 1, 2007 without a material impact on our financial position, results of operations or cash flows and no cumulative effect adjustment was required.
A reconciliation of the beginning and ending amount of unrecognized tax benefits is as follows:
| (In thousands) |
||||
| Unrecognized tax benefits balance at January 1, 2007 |
$ | 594 | ||
| Increases for tax positions of current period |
42 | |||
| Decreases resulting from settlements of prior periods |
(361 | ) | ||
| Unrecognized tax benefits balance at December 31, 2007 |
$ | 275 | ||
We are subject to U.S. federal income tax as well as income tax of multiple state tax jurisdictions. We remain open to examination by the Internal Revenue Service for tax year 2005 through the current period of 2007. We remain open to examination by substantially all of our state tax jurisdictions for tax year 2004 through the current period of 2007.
Changes in our liability for unrecognized tax benefits could affect our effective tax rate if recognized, but we do not expect any material changes within the next twelve months. Interest and penalties related to uncertain income tax positions are recorded in our “Provision for Income Taxes”.
Note 6. Related Person Transactions
Family Relationships
Each of Earl E. Congdon, John R. Congdon, David S. Congdon, John R. Congdon, Jr. and John B. Yowell are related to one another and serve in various executive management positions and/or on our Board of Directors. In addition, Earl E. Congdon, John R. Congdon and David S. Congdon beneficially own 5% or more of our common stock. In 2004, we entered into employment agreements with Earl E. Congdon, John R. Congdon, David S. Congdon and John B. Yowell, which are filed as exhibits to our annual report on Form 10-K. We regularly disclose the amount of compensation that we pay to these individuals in the proxy statement for our annual meeting of shareholders.
Transactions with Old Dominion Truck Leasing, Inc.
Old Dominion Truck Leasing, Inc. (“Leasing”), a North Carolina corporation whose voting stock is owned by the Earl E. Congdon Intangibles Trust, David S. Congdon, Trustee; the John R. Congdon Revocable Trust; and members of Earl E. Congdon’s and John R. Congdon’s families, is primarily engaged in the business of
43
OLD DOMINION FREIGHT LINE, INC.
NOTES TO THE FINANCIAL STATEMENTS—(Continued)
purchasing and leasing tractors, trailers and other vehicles. John R. Congdon is Chairman of the Board of Leasing, and Earl E. Congdon is Vice Chairman of the Board of Leasing. Since 1986, we have combined our requirements with Leasing for the purchase of tractors, trailers, equipment, parts, tires and fuel. We believe that the termination of this arrangement would not have a material adverse impact on our financial results.
For the years ended December 31, 2007, 2006 and 2005, we charged Leasing $4,000, $3,000 and $1,000, respectively, for vehicle repair, maintenance and other services we provide to Leasing at cost plus a negotiated markup. On March 15, 2003, we entered into an agreement to sublease a vehicle maintenance facility in South Bend, Indiana, to Leasing for which we charged $6,000 in 2005. Leasing terminated this rental agreement effective June 30, 2005.
We purchased $257,000, $186,000 and $237,000 of maintenance and other services from Leasing in 2007, 2006 and 2005, respectively. We believe that the prices we pay for such services are lower than would be charged by unaffiliated third parties for the same quality of work, and we intend to continue to purchase maintenance and other services from Leasing, provided that Leasing’s prices continue to be favorable to us.
We also paid Leasing $588,000, $519,000 and $33,000 for leased equipment in 2007, 2006 and 2005, respectively. The leased equipment was primarily utilized by our customers, who reimbursed us for the lease amount through a periodic billing process that included charges for additional services we provided to these customers. We believe these leasing agreements are at arm’s length, and we received no commission or other financial benefit from Leasing or any other party in connection with these lease transactions.
Split Dollar Life Insurance Policies
We are the owner of two split-dollar life insurance contracts insuring the life of John R. Congdon. The net cash surrender value for these policies was $2,258,000 and $2,100,000 at December 31, 2007 and 2006, respectively, and is included in our financial statements under the caption “Other assets”. These policies provided for an aggregate of $4,584,000 in net death benefits due to the Company at December 31, 2007, of which we have endorsed $2,000,000 to Mr. Congdon’s spouse.
Note 7. Employee Retirement Plan Contribution Expense
Substantially all employees meeting certain service requirements are eligible to participate in our 401(k) employee retirement plan. Employee contributions are limited to a percentage of their compensation, as defined in the plan. We make contributions based upon the greater of a percentage of employee contributions or ten percent of income before cumulative effect of accounting change. Company contributions for 2007, 2006 and 2005 were $7,183,000, $7,257,000 and $5,388,000, respectively.
Note 8. Share-Based Compensation
On May 16, 2005, our Board of Directors approved, and the Company adopted, the Old Dominion Freight Line, Inc. Phantom Stock Plan (the “Phantom Stock Plan”). The maximum number of shares of phantom stock available for awards to eligible employees under the Phantom Stock Plan is 375,000, subject to any change in the outstanding shares of our common stock. Our Board of Directors approved the initial grant under this plan at its January 2006 meeting and subsequent grants have been awarded annually thereafter. Shares awarded under the Phantom Stock Plan are accounted for as a liability under SFAS No. 123(R), which totaled $635,000 and $241,000 at December 31, 2007 and 2006.
44
OLD DOMINION FREIGHT LINE, INC.
NOTES TO THE FINANCIAL STATEMENTS—(Continued)
A summary of the changes in the number of phantom stock shares during the year ended December 31, 2007 is provided below.
| Number of Shares | ||
| Balance at December 31, 2006 |
26,845 | |
| Granted |
37,007 | |
| Balance at December 31, 2007 |
63,852 | |
In 1991, our Board of Directors and shareholders adopted the 1991 Employee Stock Option Plan (“Plan”) under which 843,750 shares of common stock, as adjusted for stock splits, were reserved for stock option grants to certain officers and employees. All options granted under the Plan were incentive stock options. The Plan called for options to be granted at prices not less than the fair market value on the date the option was granted, which means the closing price of a share of common stock as reported on the NASDAQ Global Select Market (formerly known as the NASDAQ National Market) on such day or the preceding day if the shares were not traded in the NASDAQ system on the grant date. On the date the option was granted, the Stock Option Plan Committee of the Board of Directors determined the period during which the option could be exercised; however, under the terms of the Plan, the option period could not extend more than ten years from the date on which the option was granted. Options could not be granted under the Plan after August 31, 2001 and the last remaining options were exercised in 2005. A summary of the changes in the number of common shares subject to option during the year ended December 31, 2005 is provided below. Shares and per share amounts have been restated for the three-for-two stock splits that occurred in 2005.
| Number of options |
Per share option price |
Weighted average exercise price | |||||||
| Balance as of December 31, 2004 |
16,875 | $ | 2.963 | $ | 2.963 | ||||
| Granted |
— | — | — | ||||||
| Exercised |
(16,875 | ) | $ | 2.963 | $ | 2.963 | |||
| Canceled |
— | — | — | ||||||
| Balance as of December 31, 2005 |
— | — | — | ||||||
At December 31, 2005 there were no remaining unexercised options under the Plan.
Note 9. Commitments and Contingencies
We are involved in various legal proceedings and claims that have arisen in the ordinary course of our business that have not been fully adjudicated. Many of these are covered in whole or in part by insurance. Our management does not believe that these actions, when finally concluded and determined, will have a material adverse effect upon our financial position or results of operations.
On July 30, 2007, the Company was named in a putative class action complaint against us and 10 other major less-than-truckload (“LTL”) motor carriers and large transportation companies offering LTL services (together, the “Defendants”). This complaint alleges that the Defendants conspired to restrain trade in violation of Section 1 of the Sherman Act in connection with fuel surcharges to customers, and seeks injunctive relief, treble damages and attorneys’ fees. Subsequent to this original complaint, similar complaints have been filed against the Defendants and other LTL motor carriers, each with the same allegation of conspiracy to fix fuel surcharge rates. On December 20, 2007, these cases were consolidated in the United States District Court for the
45
OLD DOMINION FREIGHT LINE, INC.
NOTES TO THE FINANCIAL STATEMENTS—(Continued)
Northern District of Georgia and are now in the process of being transferred to that court. Due to the nature and status of these claims, we cannot determine the likelihood of an adverse outcome nor an amount or reasonable range of potential loss, if any, in these matters. We believe that these allegations have no merit and intend to vigorously defend ourselves.
Note 10. Quarterly Financial Information (Unaudited)
A summary of our unaudited quarterly financial information for 2007 and 2006 is provided below. Our tonnage levels and revenue mix are subject to seasonal trends common in the motor carrier industry. Financial results in the first quarter are normally lower due to reduced shipments during the winter months. Harsh winter weather can also adversely impact our performance by reducing demand and increasing operating expenses.
| Quarter | |||||||||||||||
| (In thousands, except per share data) |
First | Second | Third | Fourth | Total | ||||||||||
| 2007 |
|||||||||||||||
| Revenue (1) |
$ | 319,942 | $ | 359,617 | $ | 363,298 | $ | 358,685 | $ | 1,401,542 | |||||
| Operating income |
25,044 | 40,650 | 34,017 | 30,226 | 129,937 | ||||||||||
| Net income |
13,571 | 22,539 | 20,010 | 15,712 | 71,832 | ||||||||||
| Net income per share: |
|||||||||||||||
| Basic and diluted (2) |
0.36 | 0.60 | 0.54 | 0.42 | 1.93 | ||||||||||
| 2006 |
|||||||||||||||
| Revenue |
$ | 291,631 | $ | 330,812 | $ | 337,569 | $ | 319,419 | $ | 1,279,431 | |||||
| Operating income |
23,582 | 38,602 | 36,676 | 31,625 | 130,485 | ||||||||||
| Net income |
13,020 | 21,605 | 20,103 | 17,841 | 72,569 | ||||||||||
| Net income per share: |
|||||||||||||||
| Basic and diluted |
0.35 | 0.58 | 0.54 | 0.48 | 1.95 | ||||||||||
| (1) | Our results for the second quarter of 2007 reflect a non-recurring item for the final resolution of a pricing issue under a contract with a single customer, which resulted in the recognition of an aggregate of $2 million in revenue, or $0.03 per diluted share. |
| (2) | Due to rounding, the sum of the quarterly per share amounts does not agree to the year-to-date total. |
46
Report of Independent Registered Public Accounting Firm
The Board of Directors and Shareholders
Old Dominion Freight Line, Inc.
We have audited the accompanying balance sheets of Old Dominion Freight Line, Inc. as of December 31, 2007 and 2006, and the related statements of operations, changes in shareholders’ equity, and cash flows for each of the three years in the period ended December 31, 2007. Our audits also included the financial statement schedule of Old Dominion Freight Line, Inc. listed in Item 15(a). These financial statements and schedule are the responsibility of the Company’s management. Our responsibility is to express an opinion on these financial statements and schedule based on our audits.
We conducted our audits in accordance with the standards of the Public Company Accounting Oversight Board (United States). Those standards require that we plan and perform the audit to obtain reasonable assurance about whether the financial statements are free of material misstatement. An audit includes examining, on a test basis, evidence supporting the amounts and disclosures in the financial statements. An audit also includes assessing the accounting principles used and significant estimates made by management, as well as evaluating the overall financial statement presentation. We believe that our audits provide a reasonable basis for our opinion.
In our opinion, the financial statements referred to above present fairly, in all material respects, the financial position of Old Dominion Freight Line, Inc. at December 31, 2007 and 2006, and the results of its operations and its cash flows for each of the three years in the period ended December 31, 2007, in conformity with U.S. generally accepted accounting principles. Also, in our opinion, the financial statement schedule, when considered in relation to the basic financial statements taken as a whole, presents fairly in all material respects the information set forth therein.
As discussed in Note 5 to the financial statements, in 2007 the Company adopted Interpretation No. 48, Accounting for Uncertainty in Income Taxes, an interpretation of Financial Accounting Standard No. 109 and changed its method of accounting for uncertainty for income taxes.
We also have audited, in accordance with the standards of the Public Company Accounting Oversight Board (United States), Old Dominion Freight Line, Inc.’s internal control over financial reporting as of December 31, 2007, based on criteria established in Internal Control – Integrated Framework issued by the Committee of Sponsoring Organizations of the Treadway Commission and our report dated February 27, 2008 expressed an unqualified opinion thereon.
/s/ ERNST & YOUNG LLP
Greensboro, North Carolina
February 27, 2008
47
| ITEM 9. | CHANGES IN AND DISAGREEMENTS WITH ACCOUNTANTS ON ACCOUNTING AND FINANCIAL DISCLOSURE |
None.
| ITEM 9A. | CONTROLS AND PROCEDURES |
a) Evaluation of disclosure controls and procedures
As of the end of the period covered by this report, our management has conducted an evaluation, with the participation of our Chief Executive Officer and Chief Financial Officer, of the effectiveness of our disclosure controls and procedures, in accordance with Rule 13a-15 under the Exchange Act. Based on this evaluation, our Chief Executive Officer and Chief Financial Officer concluded that our disclosure controls and procedures are effective to enable us to record, process, summarize and report in a timely manner the information that we are required to disclose in our Exchange Act reports.
b) Management’s annual report on internal control over financial reporting
Management is responsible for establishing and maintaining adequate internal control over financial reporting in accordance with Exchange Act Rule 13a-15(f). Management has conducted an evaluation, with the participation of our Chief Executive Officer and Chief Financial Officer, of the effectiveness of our internal control over financial reporting as of December 31, 2007 based on the framework in Internal Control – Integrated Framework issued by the Committee of Sponsoring Organizations of the Treadway Commission. Management concluded that our internal control over financial reporting was effective as of December 31, 2007, based on our evaluation under the framework in Internal Control – Integrated Framework.
A control system, no matter how well conceived and operated, can provide only reasonable, not absolute, assurance that the objectives of the control system are met. Further, in designing a control system, we must take into account the benefits of controls relative to their costs. Because of the inherent limitations in all control systems, no evaluation of controls can provide absolute assurance that all control issues and instances of fraud, if any, within the Company have been detected.
The effectiveness of our internal control over financial reporting as of December 31, 2007 has been audited by Ernst & Young LLP, an independent registered public accounting firm, as stated in their report which is included herein.
c) Changes in internal control over financial reporting
There were no changes in our internal control over financial reporting that occurred during the last quarter of the period covered by this report that have materially affected, or are reasonably likely to materially affect, our internal control over financial reporting.
48
Report of Independent Registered Public Accounting Firm
The Board of Directors and Shareholders of
Old Dominion Freight Line, Inc.
We have audited Old Dominion Freight Line, Inc.’s internal control over financial reporting as of December 31, 2007, based on criteria established in Internal Control—Integrated Framework issued by the Committee of Sponsoring Organizations of the Treadway Commission (the COSO criteria). Old Dominion Freight Line, Inc.’s management is responsible for maintaining effective internal control over financial reporting, and for its assessment of the effectiveness of internal control over financial reporting included in the accompanying Management’s Report on Internal Control over Financial Reporting. Our responsibility is to express an opinion on the company’s internal control over financial reporting based on our audit.
We conducted our audit in accordance with the standards of the Public Company Accounting Oversight Board (United States). Those standards require that we plan and perform the audit to obtain reasonable assurance about whether effective internal control over financial reporting was maintained in all material respects. Our audit included obtaining an understanding of internal control over financial reporting, assessing the risk that a material weakness exists, testing and evaluating the design and operating effectiveness of internal control based on the assessed risk, and performing such other procedures as we considered necessary in the circumstances. We believe that our audit provides a reasonable basis for our opinion.
A company’s internal control over financial reporting is a process designed to provide reasonable assurance regarding the reliability of financial reporting and the preparation of financial statements for external purposes in accordance with generally accepted accounting principles. A company’s internal control over financial reporting includes those policies and procedures that (1) pertain to the maintenance of records that, in reasonable detail, accurately and fairly reflect the transactions and dispositions of the assets of the company; (2) provide reasonable assurance that transactions are recorded as necessary to permit preparation of financial statements in accordance with generally accepted accounting principles, and that receipts and expenditures of the company are being made only in accordance with authorizations of management and directors of the company; and (3) provide reasonable assurance regarding prevention or timely detection of unauthorized acquisition, use, or disposition of the company’s assets that could have a material effect on the financial statements.
Because of its inherent limitations, internal control over financial reporting may not prevent or detect misstatements. Also, projections of any evaluation of effectiveness to future periods are subject to the risk that controls may become inadequate because of changes in conditions, or that the degree of compliance with the policies or procedures may deteriorate.
In our opinion, Old Dominion Freight Line, Inc. maintained, in all material respects, effective internal control over financial reporting as of December 31, 2007 based on the COSO criteria.
We also have audited, in accordance with the standards of the Public Company Accounting Oversight Board (United States), the balance sheets of Old Dominion Freight Line, Inc. as of December 31, 2007 and 2006, and the related statements of operations, changes in shareholders’ equity, and cash flows for each of the three years in the period ended December 31, 2007 and our report dated February 27, 2008 expressed an unqualified opinion thereon.
/s/ ERNST & YOUNG LLP
Greensboro, North Carolina
February 27, 2008
49
None.
ITEM 10. DIRECTORS, EXECUTIVE OFFICERS AND CORPORATE GOVERNANCE
The information required by Item 10 of Form 10-K will appear in the Company’s proxy statement for the 2008 Annual Meeting of its Shareholders under the captions “Election of Directors,” “Executive Officers,” “Section 16(a) Beneficial Ownership Reporting Compliance,” “Corporate Governance – Audit Committee,” and “Corporate Governance – Code of Business Conduct,” and the information therein is incorporated herein by reference.
ITEM 11. EXECUTIVE COMPENSATION
The information required by Item 11 of Form 10-K will appear in the Company’s proxy statement for the 2008 Annual Meeting of its Shareholders under the captions “Corporate Governance – Compensation Committee Interlocks and Insider Participation,” “Compensation Discussion and Analysis,” “Report of Compensation Committee,” and “Executive Compensation,” and the information therein is incorporated herein by reference.
| ITEM 12. | SECURITY OWNERSHIP OF CERTAIN BENEFICIAL OWNERS AND MANAGEMENT AND RELATED STOCKHOLDER MATTERS |
The information required by Item 12 of Form 10-K will appear in the Company’s proxy statement for the 2008 Annual Meeting of its Shareholders under the caption “Security Ownership of Management and Certain Beneficial Owners,” and the information therein is incorporated herein by reference.
| ITEM 13. | CERTAIN RELATIONSHIPS AND RELATED TRANSACTIONS, AND DIRECTOR INDEPENDENCE |
The information required by Item 13 of Form 10-K will appear in the Company’s proxy statement for the 2008 Annual Meeting of its Shareholders under the captions “Corporate Governance – Independent Directors” and “Related Person Transactions,” and the information therein is incorporated herein by reference.
| ITEM 14. | PRINCIPAL ACCOUNTING FEES AND SERVICES |
The information required by Item 14 of Form 10-K will appear in the Company’s proxy statement for the 2008 Annual Meeting of its Shareholders under the captions “Corporate Governance – Audit Committee Pre-Approval Policies and Procedures” and “Independent Registered Public Accounting Firm Fees and Services,” and the information therein is incorporated herein by reference.
50
| ITEM 15. | EXHIBITS, FINANCIAL STATEMENT SCHEDULES |
(a)(1) Financial Statements.
The following financial statements of Old Dominion Freight Line, Inc. are included in Item 8:
(a)(2) Financial Statement Schedules.
The Schedule II – “Valuation and Qualifying Accounts” schedule of Old Dominion Freight Line, Inc. is included below:
Schedule II
Old Dominion Freight Line, Inc.
Valuation and Qualifying Accounts
| Allowance for Uncollectible Accounts (1) | ||||||||||||
| Year Ended December 31, |
Balance at Beginning of Period |
Charged to Costs and Expenses |
Deductions (2) | Balance at End of Period | ||||||||
| 2005 |
$ | 6,609,000 | $ | 2,800,000 | $ | 2,627,000 | $ | 6,782,000 | ||||
| 2006 |
$ | 6,782,000 | $ | 4,634,000 | $ | 2,339,000 | $ | 9,077,000 | ||||
| 2007 |
$ | 9,077,000 | $ | 2,771,000 | $ | 1,426,000 | $ | 10,422,000 | ||||
| (1) | This table does not include any allowances for revenue adjustments that result from billing corrections, customer allowances, money-back service guarantees and other miscellaneous revenue adjustments that are recorded in our revenue from operations. |
| (2) | Uncollectible accounts written off, net of recoveries. |
All other schedules for which provision is made in the applicable accounting regulations of the Securities and Exchange Commission are not required under the instructions or are inapplicable and, therefore, have been omitted.
(a)(3) Exhibits Filed.
The exhibits listed in the accompanying Exhibit Index are filed as a part of this report.
(b) Exhibits.
See Exhibit Index.
(c) Separate Financial Statement and Schedules.
None.
51
Pursuant to the requirements of Section 13 or 15(d) of the Securities Exchange Act of 1934, the registrant has duly caused this report to be signed on its behalf by the undersigned, thereunto duly authorized.
| OLD DOMINION FREIGHT LINE, INC. | ||
| By: |
/S/ DAVID S. CONGDON | |
| David S. Congdon Chief Executive Officer | ||
Dated: February 28, 2008
Pursuant to the requirements of the Securities Exchange Act of 1934, this report has been signed below by the following persons on behalf of the registrant and in the capacities and on the dates indicated:
| Name and Signature |
Position |
Date | ||
| /S/ EARL E. CONGDON Earl E. Congdon |
Executive Chairman of the Board of Directors |
February 28, 2008 | ||
| /S/ DAVID S. CONGDON David S. Congdon |
Director, President and Chief Executive Officer |
February 28, 2008 | ||
| /S/ JOHN R. CONGDON John R. Congdon |
Vice Chairman of the Board and Senior Vice President |
February 28, 2008 | ||
| /S/ J. PAUL BREITBACH J. Paul Breitbach |
Director |
February 28, 2008 | ||
| /S/ JOHN R. CONGDON, JR. John R. Congdon, Jr. |
Director |
February 28, 2008 | ||
| /S/ ROBERT G. CULP, III Robert G. Culp, III |
Director |
February 28, 2008 | ||
| /S/ JOHN A. EBELING John A. Ebeling |
Director |
February 28, 2008 | ||
| /S/ FRANZ F. HOLSCHER Franz F. Holscher |
Director |
February 28, 2008 | ||
| /S/ JOHN D. KASARDA John D. Kasarda |
Director |
February 28, 2008 | ||
| /S/ J. WES FRYE J. Wes Frye |
Senior Vice President - Finance (Principal Financial Officer) |
February 28, 2008 | ||
| /S/ JOHN P. BOOKER III John P. Booker III |
Vice President - Controller |
February 28, 2008 | ||
52
TO ANNUAL REPORT ON FORM 10-K
OLD DOMINION FREIGHT LINE, INC.
FOR YEAR ENDED DECEMBER 31, 2007
| Exhibit No. |
Description | |
| 3.1.1(f) | Amended and Restated Articles of Incorporation (as amended July 30, 2004) | |
| 3.2 | Amended and Restated Bylaws of Old Dominion Freight Line, Inc. | |
| 4.1(a) | Specimen certificate of Common Stock | |
| 4.6(b) | Note Purchase Agreement among Nationwide Life Insurance Company, New York Life Insurance and Annuity Corporation Institutionally Owned Life Insurance Separate Account and Old Dominion Freight Line, Inc., dated as of February 25, 1998 | |
| 4.6.1(b) | Forms of notes issued by Old Dominion Freight Line, Inc. pursuant to the Note Purchase Agreement among Nationwide Life Insurance Company, New York Life Insurance and Annuity Corporation Institutionally Owned Life Insurance Separate Account and Old Dominion Freight Line, Inc., dated February 25, 1998 | |
| 4.6.2(c) | Note Purchase and Shelf Agreement among Old Dominion Freight Line, Inc., Prudential Insurance Company of America, Pruco Life Insurance Company, Pruco Life Insurance Company of New Jersey and Hartford Life Insurance Company, dated as of May 1, 2001 | |
| 4.6.3(d) | Amendment No. 1 to Note Purchase and Shelf Agreement among Old Dominion Freight Line, Inc. and the Noteholders set forth in Annex 1 thereto, dated June 27, 2003 | |
| 4.6.10(h) | Note Purchase Agreement among Old Dominion Freight Line, Inc. and the Purchasers set forth in Schedule A thereto, dated as of February 25, 2005 | |
| 4.8(i) | Credit Agreement among Wachovia Bank, National Association, as Agent, Bank of America, N.A., Branch Banking & Trust Company and Old Dominion Freight Line, Inc., dated September 22, 2005 | |
| 4.8.1(l) | First Amendment to the Credit Agreement among Wachovia Bank, National Association, as Agent, Bank of America, N.A., Branch Banking & Trust Company and Old Dominion Freight Line, Inc., dated April 21, 2006. | |
| 4.9(l) | Note Purchase Agreement among Old Dominion Freight Line, Inc. and the Purchasers set forth in Schedule A thereto, dated as of April 25, 2006. | |
| 4.10(m) | Amended and Restated Credit Agreement among Wachovia Bank, National Association, as Administrative Agent; the Lenders named therein; and Old Dominion Freight Line, Inc., dated as of August 10, 2006 | |
| 10.4(a)* | 1991 Employee Stock Option Plan of Old Dominion Freight Line, Inc. | |
| 10.5(a)* | Stock Option Agreement pursuant to the 1991 Employee Stock Option Plan of Old Dominion Freight Line, Inc. (included in Exhibit 10.4) | |
| 10.17.1(e)* | Employment Agreement by and between Old Dominion Freight Line, Inc. and Earl E. Congdon, effective as of June 1, 2004 | |
| 10.17.2(e)* | Employment Agreement by and between Old Dominion Freight Line, Inc. and John R. Congdon, effective as of June 1, 2004 | |
| 10.17.3(e)* | Employment Agreement by and between Old Dominion Freight Line, Inc. and David S. Congdon, effective as of June 1, 2004 | |
| 10.17.4(e)* | Employment Agreement by and between Old Dominion Freight Line, Inc. and John B. Yowell, effective as of June 1, 2004 | |
| 10.17.5(f) | Underwriting Agreement among Old Dominion Freight Line, Inc. and Legg Mason Wood Walker, Incorporated, BB&T Capital Markets, a division of Scott & Stringfellow, Inc. and Stephens, Inc., as representatives of the several underwriters, dated July 20, 2004 | |
| Exhibit No. |
Description | |
| 10.18.2(g)* | Non-Executive Director Compensation Structure, effective July 31, 2006 | |
| 10.19.1(j)* | Old Dominion Freight Line, Inc. Phantom Stock Plan, effective as of May 16, 2005 | |
| 10.19.2(j)* | Old Dominion Freight Line, Inc. Change of Control Severance Plan for Key Executives, effective as of May 16, 2005 | |
| 10.19.3(k)* | Form of Old Dominion Freight Line, Inc. Phantom Stock Award Agreement | |
| 10.20.1(k)* | 2006 Nonqualified Deferred Compensation Plan of Old Dominion Freight Line, Inc., effective January 1, 2006 | |
| 10.20.2(k)* | Form of Annual Salary and Bonus Deduction Agreement | |
| 31.1 | Certification Pursuant to Rule 13a-14(a) or 15d-14(a) of the Exchange Act, as Adopted Pursuant to Section 302 of the Sarbanes-Oxley Act of 2002 | |
| 31.2 | Certification Pursuant to Rule 13a-14(a) or 15d-14(a) of the Exchange Act, as Adopted Pursuant to Section 302 of the Sarbanes-Oxley Act of 2002 | |
| 32.1 | Certification Pursuant to 18 U.S.C Section 1350, as Adopted Pursuant to Section 906 of the Sarbanes-Oxley Act of 2002 | |
| 32.2 | Certification Pursuant to 18 U.S.C Section 1350, as Adopted Pursuant to Section 906 of the Sarbanes-Oxley Act of 2002 | |
| (a) | Incorporated by reference to the exhibit of the same number contained in the Company’s registration statement on Form S-1 filed under the Securities Act of 1933 (SEC File: 33-42631) |
| (b) | Incorporated by reference to the exhibit of the same number contained in the Company’s Annual Report on Form 10-K for the year ended December 31, 1997 |
| (c) | Incorporated by reference to the exhibit of the same number contained in the Company’s Quarterly Report on Form 10-Q for the quarter ended June 30, 2001 |
| (d) | Incorporated by reference to the exhibit of the same number contained in the Company’s Quarterly Report on Form 10-Q for the quarter ended June 30, 2003 |
| (e) | Incorporated by reference to the exhibit of the same number contained in the Company’s Current Report on Form 8-K filed on June 10, 2004 |
| (f) | Incorporated by reference to the exhibit of the same number contained in the Company’s Quarterly Report on Form 10-Q for the quarter ended June 30, 2004 |
| (g) | Incorporated by reference to the exhibit of the same number contained in the Company’s Current Report on Form 8-K filed on August 3, 2006 |
| (h) | Incorporated by reference to the exhibit of the same number contained in the Company’s Annual Report on Form 10-K for the year ended December 31, 2004 |
| (i) | Incorporated by reference to the exhibit of the same number contained in the Company’s Current Report on Form 8-K filed on September 28, 2005 |
| (j) | Incorporated by reference to the exhibit of the same number contained in the Company’s Current Report on Form 8-K filed on May 20, 2005 |
| (k) | Incorporated by reference to the exhibit of the same number contained in the Company’s Current Report on Form 8-K filed on February 21, 2006 |
| (l) | Incorporated by reference to the exhibit of the same number contained in the Company’s Current Report on Form 8-K filed on May 1, 2006 |
| (m) | Incorporated by reference to the exhibit of the same number contained in the Company’s Current Report on Form 8-K filed on August 16, 2006 |
| * | Denotes an executive compensation plan or agreement |
Our SEC file number reference for documents filed with the SEC pursuant to the Securities Exchange Act of 1934, as amended, is 000-19582.